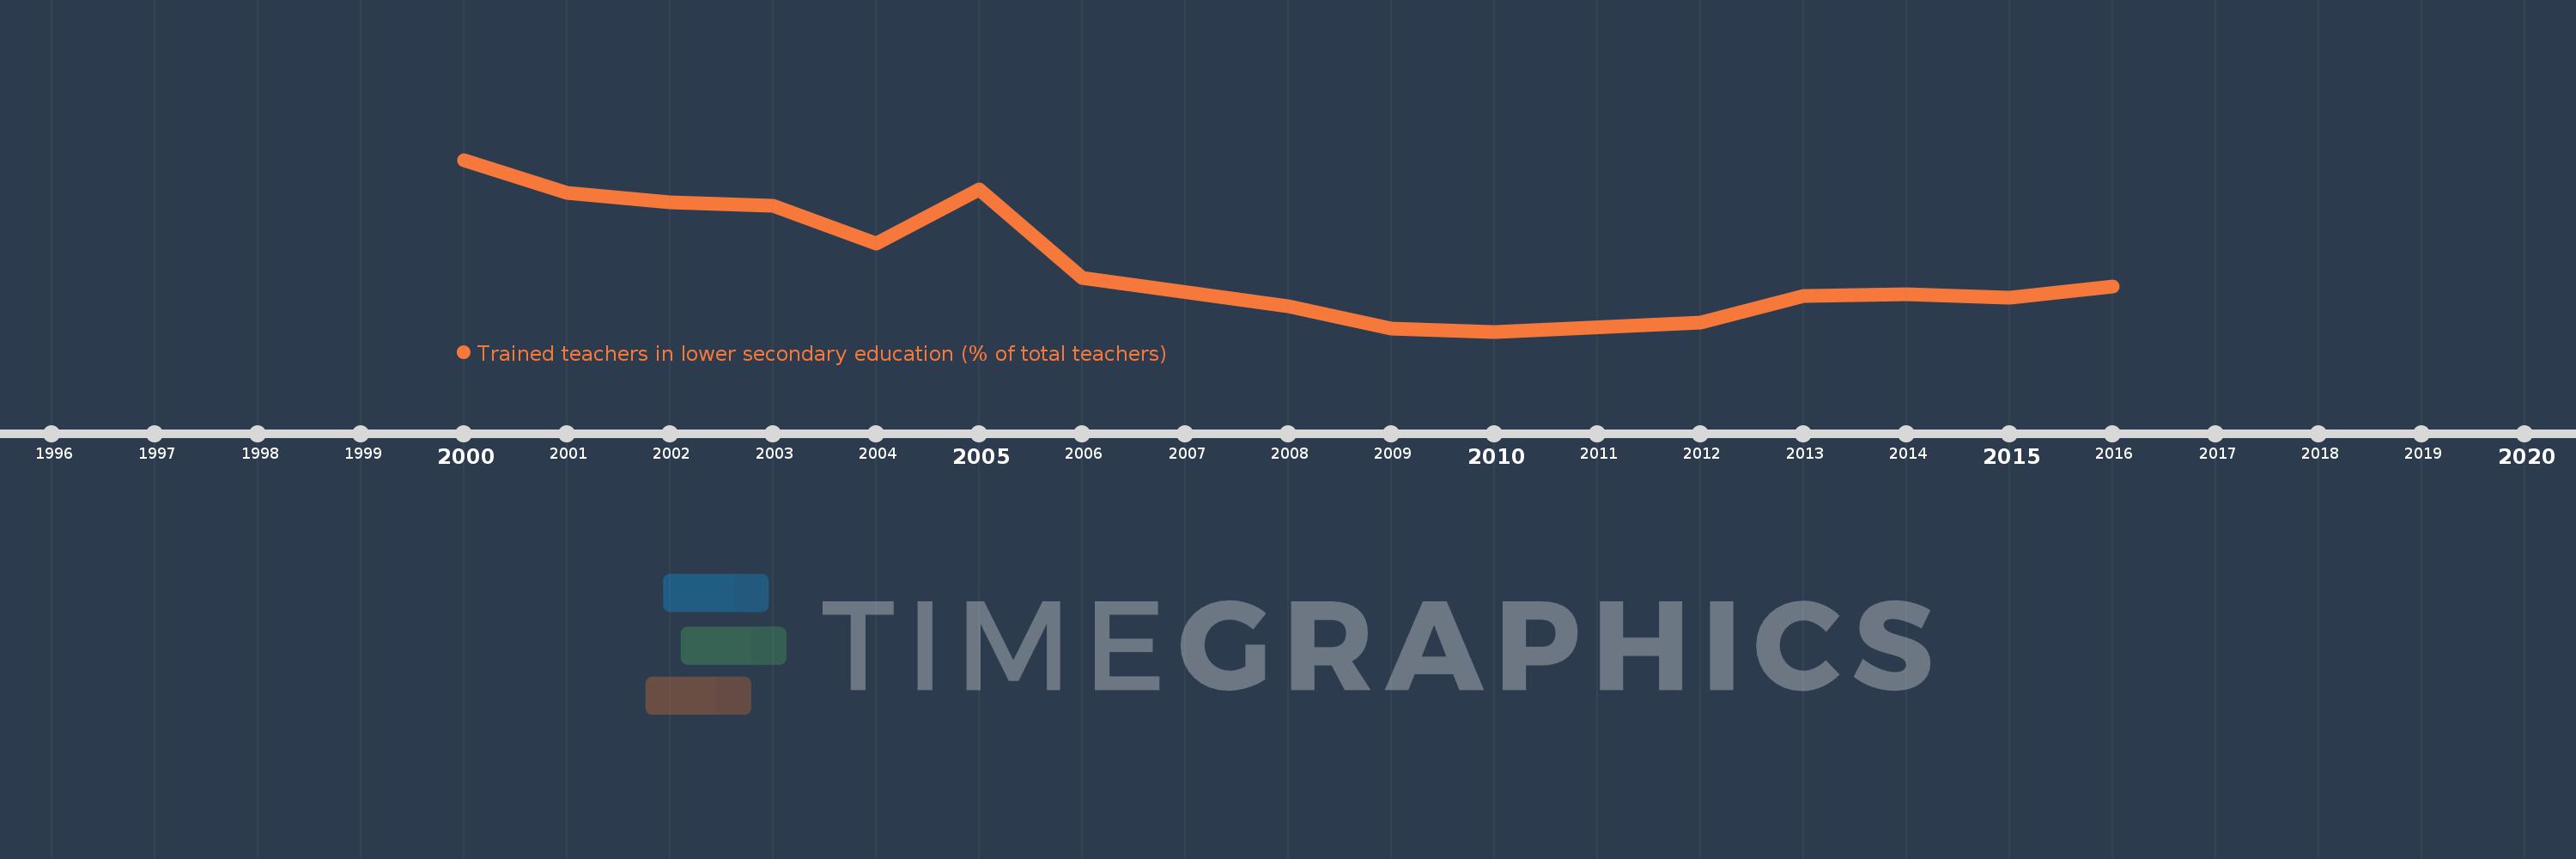
Questa scala temporale mostra un grafico dal 2000 anno al 2016 anno. Ghana. I dati fino ad 1999 anno non disponibili. Il numero di osservazioni attuali secondo i date: 15.
La fonte (nome):
Indicatori dello sviluppo mondiale
La fonte (organizzazione):
United Nations Educational, Scientific, and Cultural Organization (UNESCO) Institute for Statistics.
Categorie:
Education
sono stati aggiornati
23 apr 2017 anni
Indicatori delle variazioni dei valori per anni
In media:
72.412
Minima:
64.815
1 gen 2010 anni
Massimo:
83.65
1 gen 2000 anni
Alla data di osservazione
Valore
Variazione assoluta
La variazione rispetto al valore precedente
1 gen 2000 anni
83.65
+83.65
0.0%
1 gen 2001 anni
80.043
-3.607
-4.31%
1 gen 2002 anni
78.984
-1.06
-1.32%
1 gen 2003 anni
78.632
-0.351
-0.44%
1 gen 2004 anni
74.457
-4.175
-5.31%
1 gen 2005 anni
80.406
+5.949
7.99%
1 gen 2006 anni
70.728
-9.678
-12.04%
1 gen 2008 anni
67.626
-3.102
-4.39%
1 gen 2009 anni
65.172
-2.454
-3.63%
1 gen 2010 anni
64.815
-0.356
-0.55%
1 gen 2012 anni
65.758
+0.943
1.45%
1 gen 2013 anni
68.728
+2.97
4.52%
1 gen 2014 anni
68.865
+0.137
0.2%
1 gen 2015 anni
68.515
-0.35
-0.51%
1 gen 2016 anni
69.806
+1.291
1.88%
Classificazione dei paesi secondo i statistiche attuali per anni