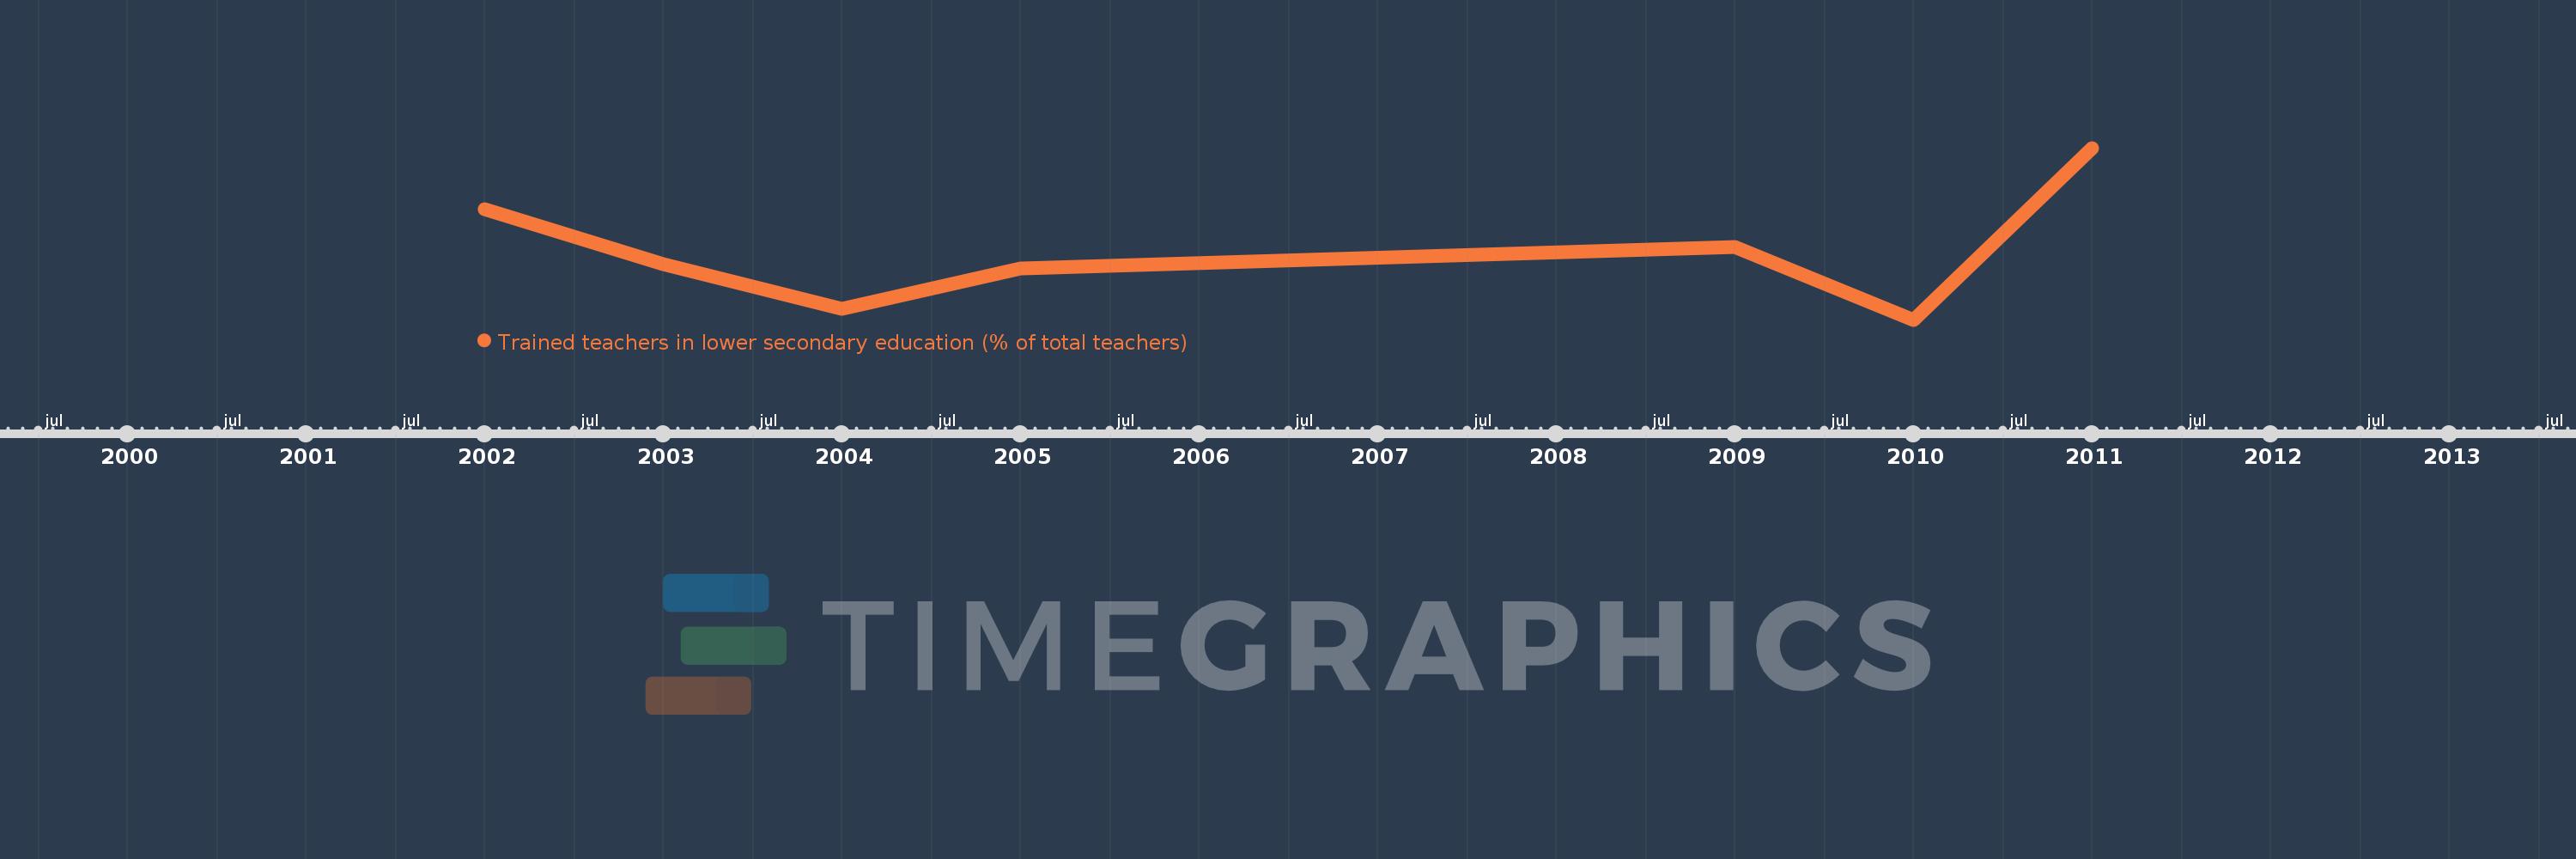
Questa scala temporale mostra un grafico dal 2002 anno al 2011 anno. St. Vincent and the Grenadines. I dati fino ad 2001 anno non disponibili. Il numero di osservazioni attuali secondo i date: 7.
La fonte (nome):
Indicatori dello sviluppo mondiale
La fonte (organizzazione):
United Nations Educational, Scientific, and Cultural Organization (UNESCO) Institute for Statistics.
Categorie:
Education
sono stati aggiornati
23 apr 2017 anni
Indicatori delle variazioni dei valori per anni
In media:
55.233
Minima:
49.362
1 gen 2010 anni
Massimo:
64.303
1 gen 2011 anni
Alla data di osservazione
Valore
Variazione assoluta
La variazione rispetto al valore precedente
1 gen 2002 anni
58.947
+58.947
0.0%
1 gen 2003 anni
54.181
-4.767
-8.09%
1 gen 2004 anni
50.321
-3.86
-7.12%
1 gen 2005 anni
53.81
+3.489
6.93%
1 gen 2009 anni
55.71
+1.901
3.53%
1 gen 2010 anni
49.362
-6.348
-11.39%
1 gen 2011 anni
64.303
+14.94
30.27%
Classificazione dei paesi secondo i statistiche attuali per anni