Questa scala temporale mostra un grafico dal 1998 anno al 2015 anno. IDA only. I dati fino ad 1997 anno non disponibili. Il numero di osservazioni attuali secondo i date: 18.
La fonte (nome):
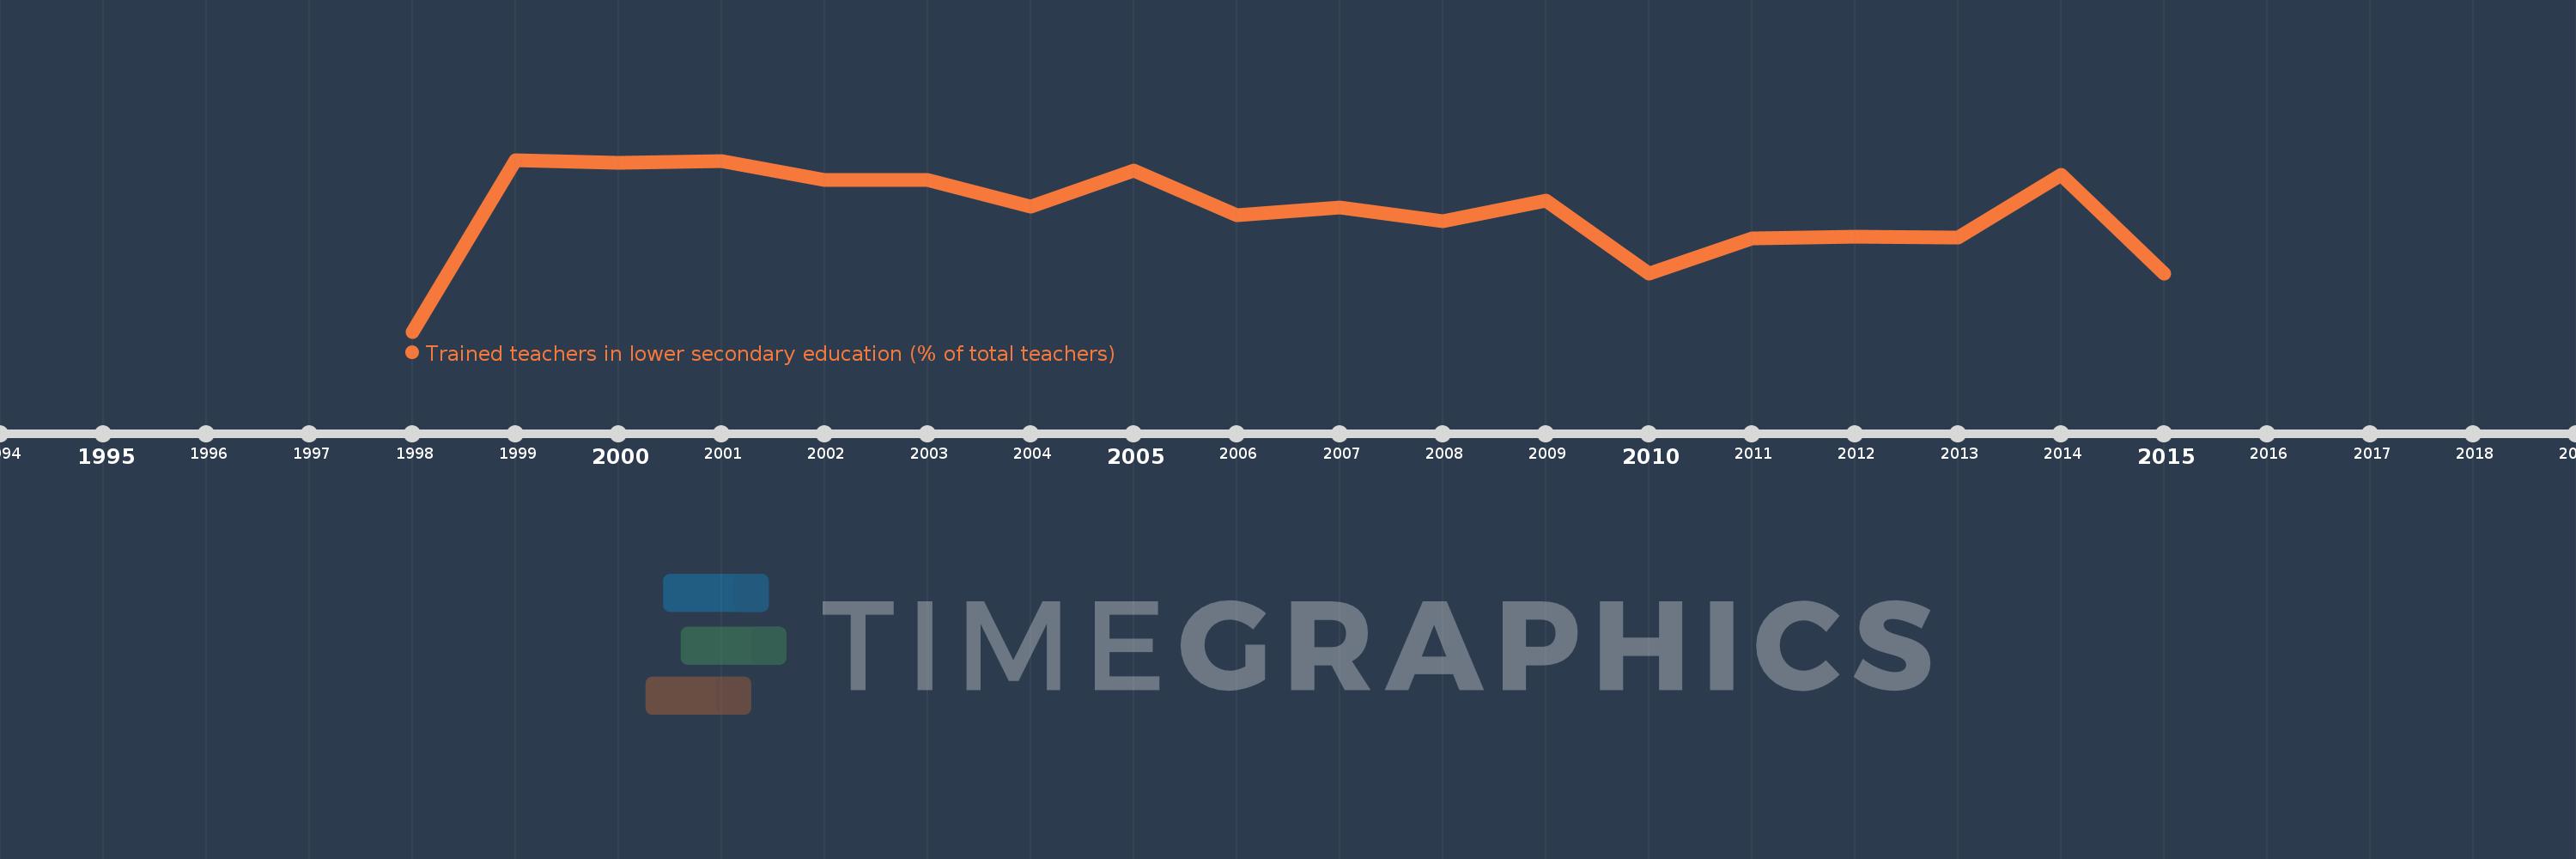
Indicatori dello sviluppo mondiale
La fonte (organizzazione):
United Nations Educational, Scientific, and Cultural Organization (UNESCO) Institute for Statistics.
Categorie:
Education
sono stati aggiornati
23 apr 2017 anni
Indicatori delle variazioni dei valori per anni
In media:
67.776
Minima:
57.632
1 gen 1998 anni
Massimo:
72.314
1 gen 1999 anni
Alla data di osservazione
Valore
Variazione assoluta
La variazione rispetto al valore precedente
1 gen 1998 anni
57.632
+57.632
0.0%
1 gen 1999 anni
72.314
+14.682
25.48%
1 gen 2000 anni
72.044
-0.269
-0.37%
1 gen 2001 anni
72.201
+0.157
0.22%
1 gen 2002 anni
70.622
-1.579
-2.19%
1 gen 2003 anni
70.613
-0.008
-0.01%
1 gen 2004 anni
68.281
-2.333
-3.3%
1 gen 2005 anni
71.362
+3.081
4.51%
1 gen 2006 anni
67.567
-3.795
-5.32%
1 gen 2007 anni
68.267
+0.7
1.04%
1 gen 2008 anni
67.057
-1.21
-1.77%
1 gen 2009 anni
68.792
+1.735
2.59%
1 gen 2010 anni
62.573
-6.219
-9.04%
1 gen 2011 anni
65.61
+3.037
4.85%
1 gen 2012 anni
65.748
+0.138
0.21%
1 gen 2013 anni
65.706
-0.042
-0.06%
1 gen 2014 anni
70.998
+5.292
8.05%
1 gen 2015 anni
62.589
-8.409
-11.84%
Classificazione dei paesi secondo i statistiche attuali per anni