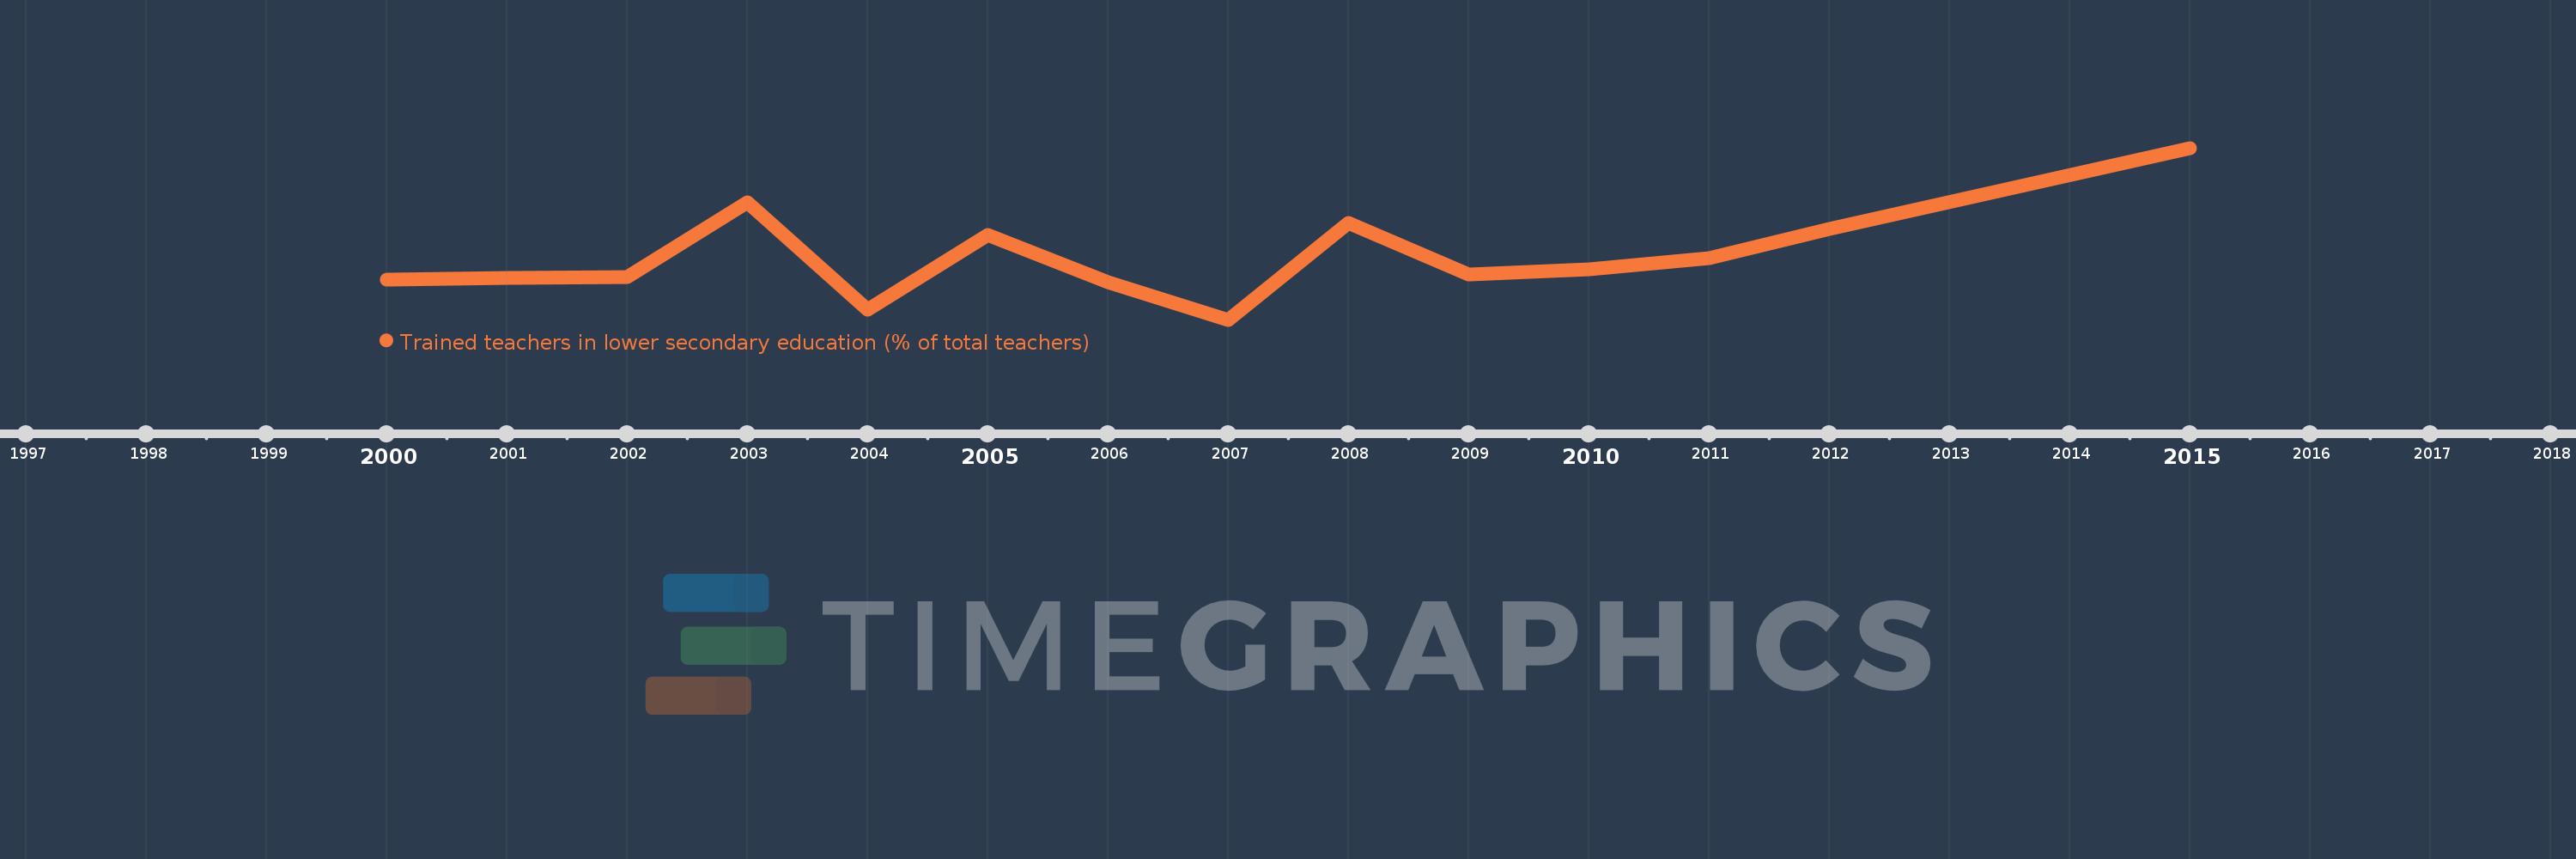
Questa scala temporale mostra un grafico dal 2000 anno al 2015 anno. Dominica. I dati fino ad 1999 anno non disponibili. Il numero di osservazioni attuali secondo i date: 14.
La fonte (nome):
Indicatori dello sviluppo mondiale
La fonte (organizzazione):
United Nations Educational, Scientific, and Cultural Organization (UNESCO) Institute for Statistics.
Categorie:
Education
sono stati aggiornati
23 apr 2017 anni
Indicatori delle variazioni dei valori per anni
In media:
33.922
Minima:
26.721
1 gen 2007 anni
Massimo:
46.154
1 gen 2015 anni
Alla data di osservazione
Valore
Variazione assoluta
La variazione rispetto al valore precedente
1 gen 2000 anni
31.25
+31.25
0.0%
1 gen 2001 anni
31.496
+0.246
0.79%
1 gen 2002 anni
31.579
+0.083
0.26%
1 gen 2003 anni
40.0
+8.421
26.67%
1 gen 2004 anni
27.864
-12.136
-30.34%
1 gen 2005 anni
36.306
+8.442
30.3%
1 gen 2006 anni
30.986
-5.32
-14.65%
1 gen 2007 anni
26.721
-4.265
-13.77%
1 gen 2008 anni
37.647
+10.926
40.89%
1 gen 2009 anni
31.818
-5.829
-15.48%
1 gen 2010 anni
32.394
+0.576
1.81%
1 gen 2011 anni
33.677
+1.283
3.96%
1 gen 2012 anni
37.011
+3.334
9.9%
1 gen 2015 anni
46.154
+9.143
24.7%
Classificazione dei paesi secondo i statistiche attuali per anni