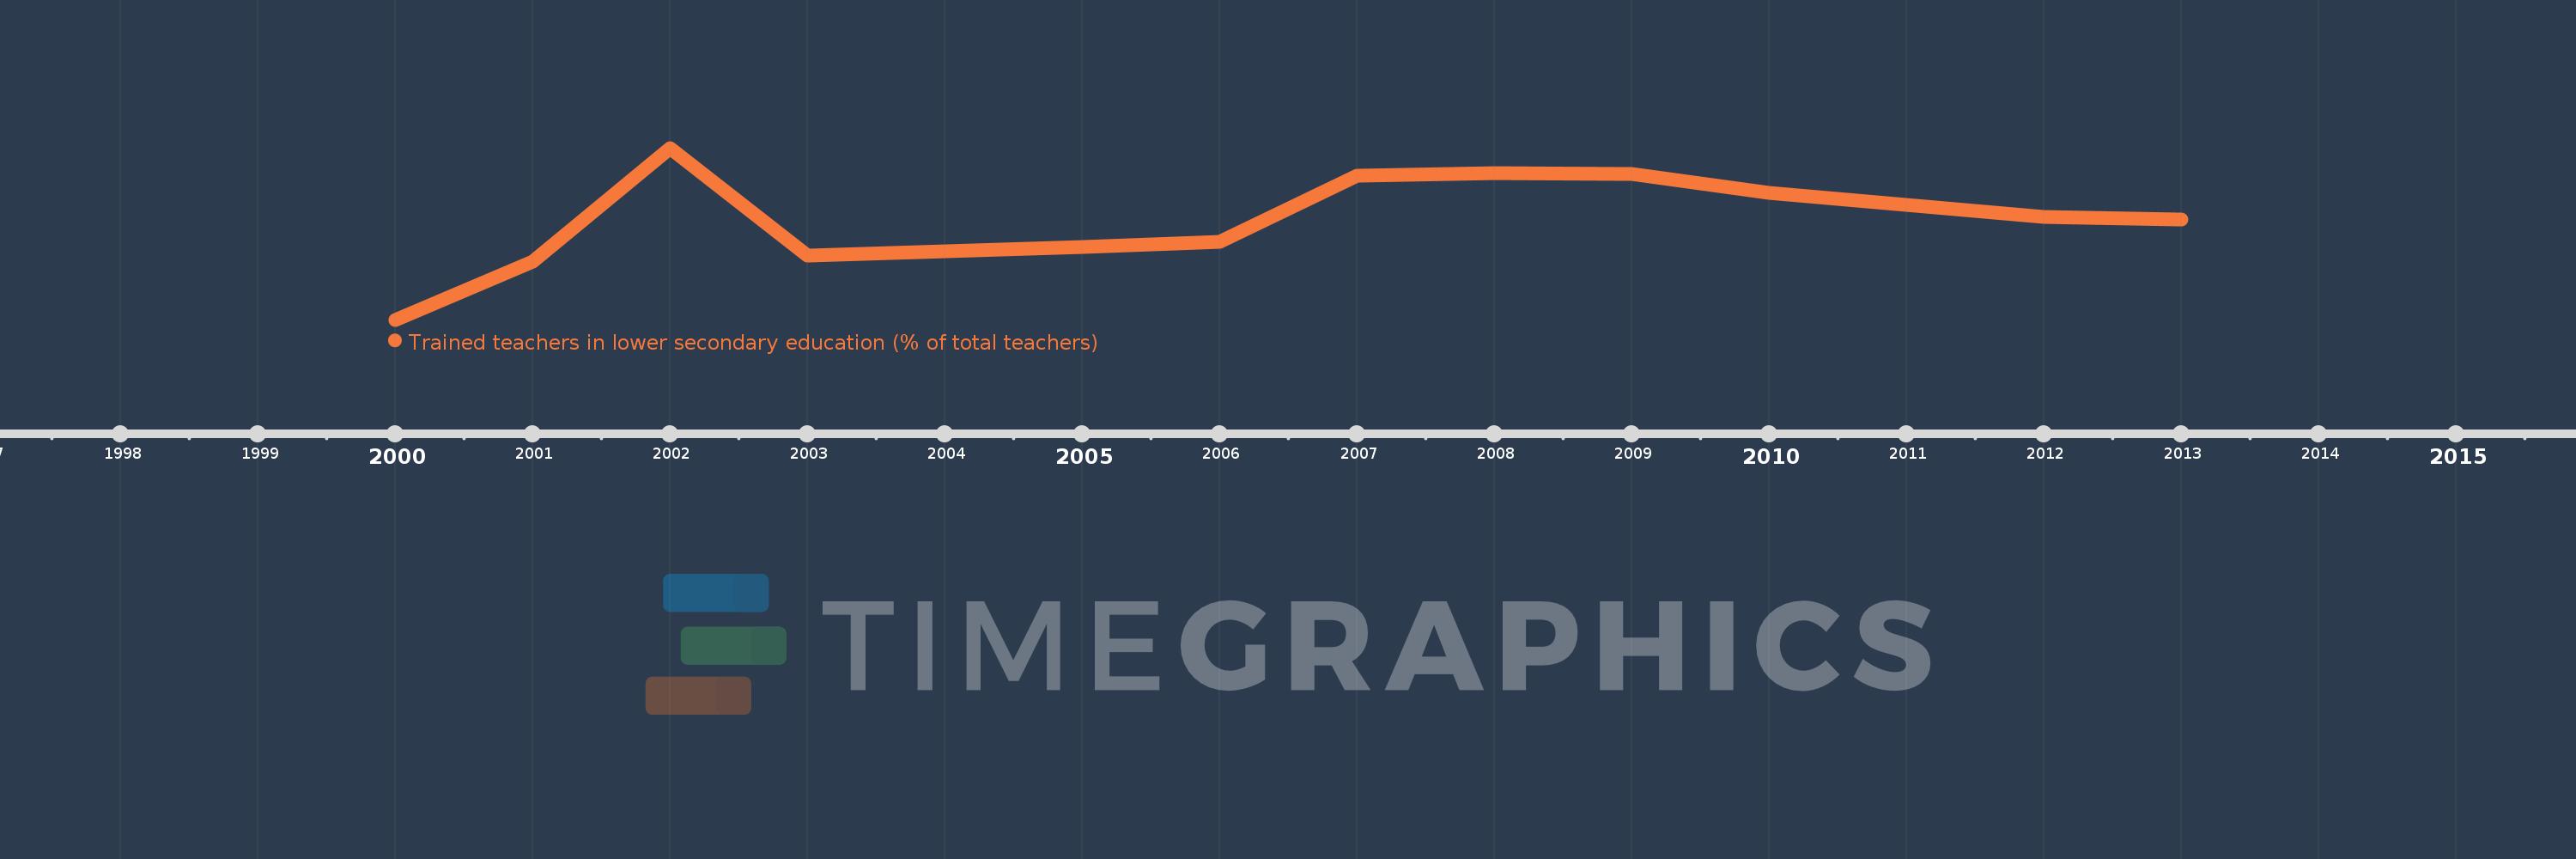
Questa scala temporale mostra un grafico dal 2000 anno al 2013 anno. Panama. I dati fino ad 1999 anno non disponibili. Il numero di osservazioni attuali secondo i date: 13.
La fonte (nome):
Indicatori dello sviluppo mondiale
La fonte (organizzazione):
United Nations Educational, Scientific, and Cultural Organization (UNESCO) Institute for Statistics.
Categorie:
Education
sono stati aggiornati
23 apr 2017 anni
Indicatori delle variazioni dei valori per anni
In media:
85.162
Minima:
74.056
1 gen 2000 anni
Massimo:
92.786
1 gen 2002 anni
Alla data di osservazione
Valore
Variazione assoluta
La variazione rispetto al valore precedente
1 gen 2000 anni
74.056
+74.056
0.0%
1 gen 2001 anni
80.355
+6.299
8.51%
1 gen 2002 anni
92.786
+12.431
15.47%
1 gen 2003 anni
81.014
-11.773
-12.69%
1 gen 2005 anni
82.003
+0.989
1.22%
1 gen 2006 anni
82.504
+0.501
0.61%
1 gen 2007 anni
89.733
+7.229
8.76%
1 gen 2008 anni
90.022
+0.289
0.32%
1 gen 2009 anni
89.987
-0.035
-0.04%
1 gen 2010 anni
87.863
-2.124
-2.36%
1 gen 2011 anni
86.549
-1.314
-1.5%
1 gen 2012 anni
85.256
-1.293
-1.49%
1 gen 2013 anni
84.974
-0.282
-0.33%
Classificazione dei paesi secondo i statistiche attuali per anni