Download Queste statistiche in altri paesi:
Linea del tempo:
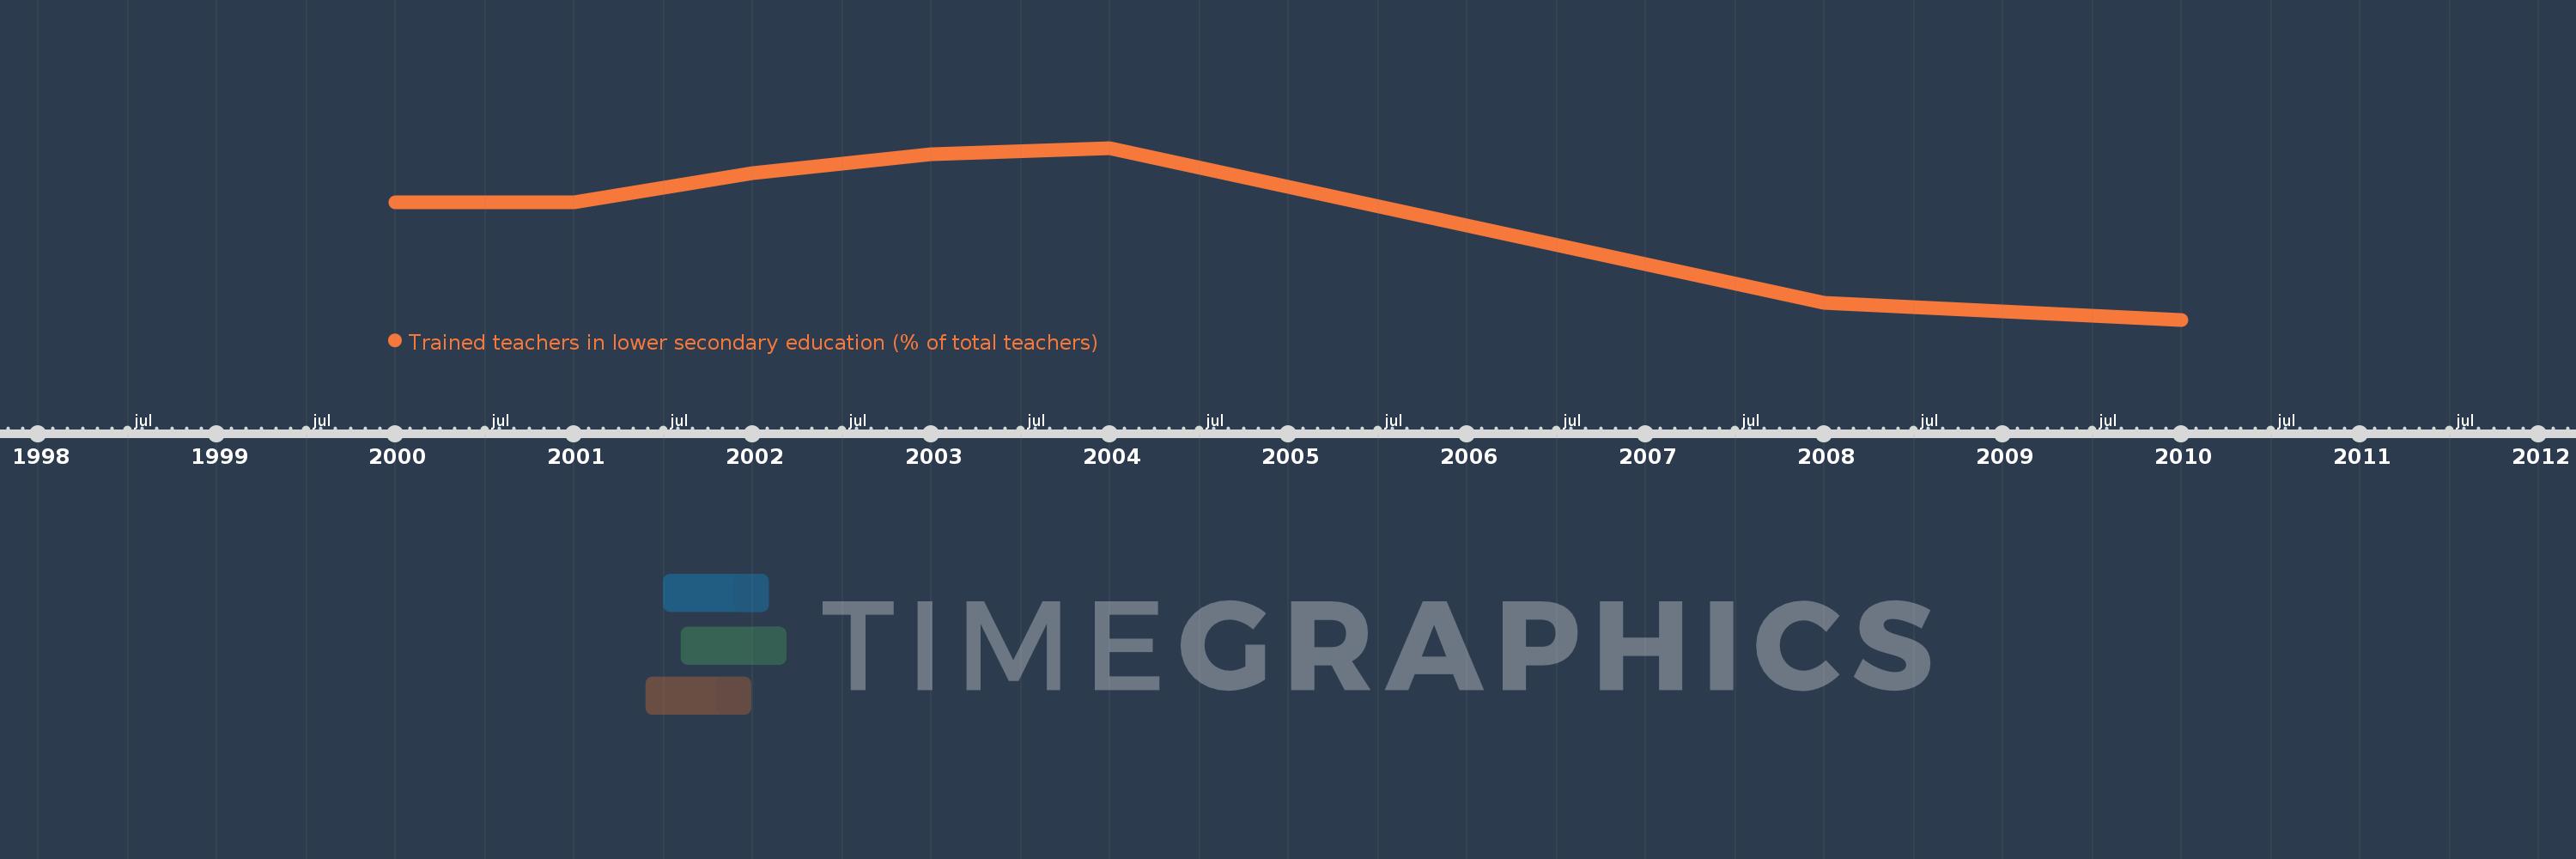
Questa scala temporale mostra un grafico dal 2000 anno al 2010 anno. Trinidad and Tobago. I dati fino ad 1999 anno non disponibili. Il numero di osservazioni attuali secondo i date: 7.
La fonte (nome):
Indicatori dello sviluppo mondiale
La fonte (organizzazione):
United Nations Educational, Scientific, and Cultural Organization (UNESCO) Institute for Statistics.
Categorie:
Education
sono stati aggiornati
23 apr 2017 anni
Indicatori delle variazioni dei valori per anni
Minima:
40.378
1 gen 2010 anni
Massimo:
58.003
1 gen 2004 anni
Alla data di osservazione
Valore
Variazione assoluta
La variazione rispetto al valore precedente
1 gen 2000 anni
52.412
+52.412
0.0%
1 gen 2001 anni
52.399
-0.013
-0.02%
1 gen 2002 anni
55.398
+3.0
5.72%
1 gen 2003 anni
57.396
+1.998
3.61%
1 gen 2004 anni
58.003
+0.607
1.06%
1 gen 2008 anni
42.103
-15.9
-27.41%
1 gen 2010 anni
40.378
-1.725
-4.1%
Classificazione dei paesi secondo i statistiche attuali per anni