33
/es/
AIzaSyAYiBZKx7MnpbEhh9jyipgxe19OcubqV5w
May 1, 2025
62220
Upper middle income
UMC
false
2
1
Stocks traded, total value (current US$)
2016,2015,2014,2013,2012,2011,2010,2009,2008,2007,2006,2005,2004,2003,2002,2001,2000,1999,1998,1997,1996,1995,1994
Download
Estadísticas Globales de la Biblioteca →Upper middle income →

Stocks traded, total value (current US$)

Estas estadísticas en otros países:

Arab WorldArgentinaArmeniaAustraliaAustriaBahrainBangladeshBarbadosBelgiumBermudaBoliviaBotswanaBrazilBulgariaCanadaCayman IslandsCentral Europe and the BalticsChannel IslandsChileChinaColombiaCosta RicaCote d'IvoireCroatiaCyprusCzech RepublicDenmarkEarly-demographic dividendEast Asia & PacificEast Asia & Pacific (excluding high income)East Asia & Pacific (IDA & IBRD countries)EcuadorEgypt, Arab Rep.El SalvadorEstoniaEuro areaEurope & Central AsiaEurope & Central Asia (excluding high income)Europe & Central Asia (IDA & IBRD countries)European UnionFijiFinlandFranceGeorgiaGermanyGhanaGreeceGuyanaHigh incomeHong Kong SAR, ChinaHungaryIBRD onlyIcelandIDA & IBRD totalIDA blendIDA totalIndiaIndonesiaIran, Islamic Rep.IrelandIsraelItalyJamaicaJapanJordanKazakhstanKenyaKorea, Rep.KuwaitKyrgyz RepublicLate-demographic dividendLatin America & Caribbean Latin America & Caribbean (excluding high income)Latin America & the Caribbean (IDA & IBRD countries)LatviaLebanonLithuaniaLow & middle incomeLower middle incomeLuxembourgMacedonia, FYRMalawiMalaysiaMaltaMauritiusMexicoMiddle East & North AfricaMiddle East & North Africa (excluding high income)Middle East & North Africa (IDA & IBRD countries)Middle incomeMoldovaMongoliaMontenegroMoroccoNamibiaNetherlandsNew ZealandNigeriaNorth AmericaNorwayOECD membersOmanOther small statesPakistanPanamaPapua New GuineaParaguayPeruPhilippinesPolandPortugalPost-demographic dividendQatarRomaniaRussian FederationSaudi ArabiaSerbiaSeychellesSingaporeSlovak RepublicSloveniaSouth AfricaSouth AsiaSouth Asia (IDA & IBRD)SpainSri LankaSt. Kitts and NevisSub-Saharan Africa Sub-Saharan Africa (excluding high income)Sub-Saharan Africa (IDA & IBRD countries)SwazilandSwedenSwitzerlandTanzaniaThailandTrinidad and TobagoTunisiaTurkeyUgandaUkraineUnited Arab EmiratesUnited KingdomUnited StatesUpper middle incomeUruguayUzbekistanVenezuela, RBVietnamWest Bank and GazaWorldZambiaZimbabwe

línea de tiempo (timeline):

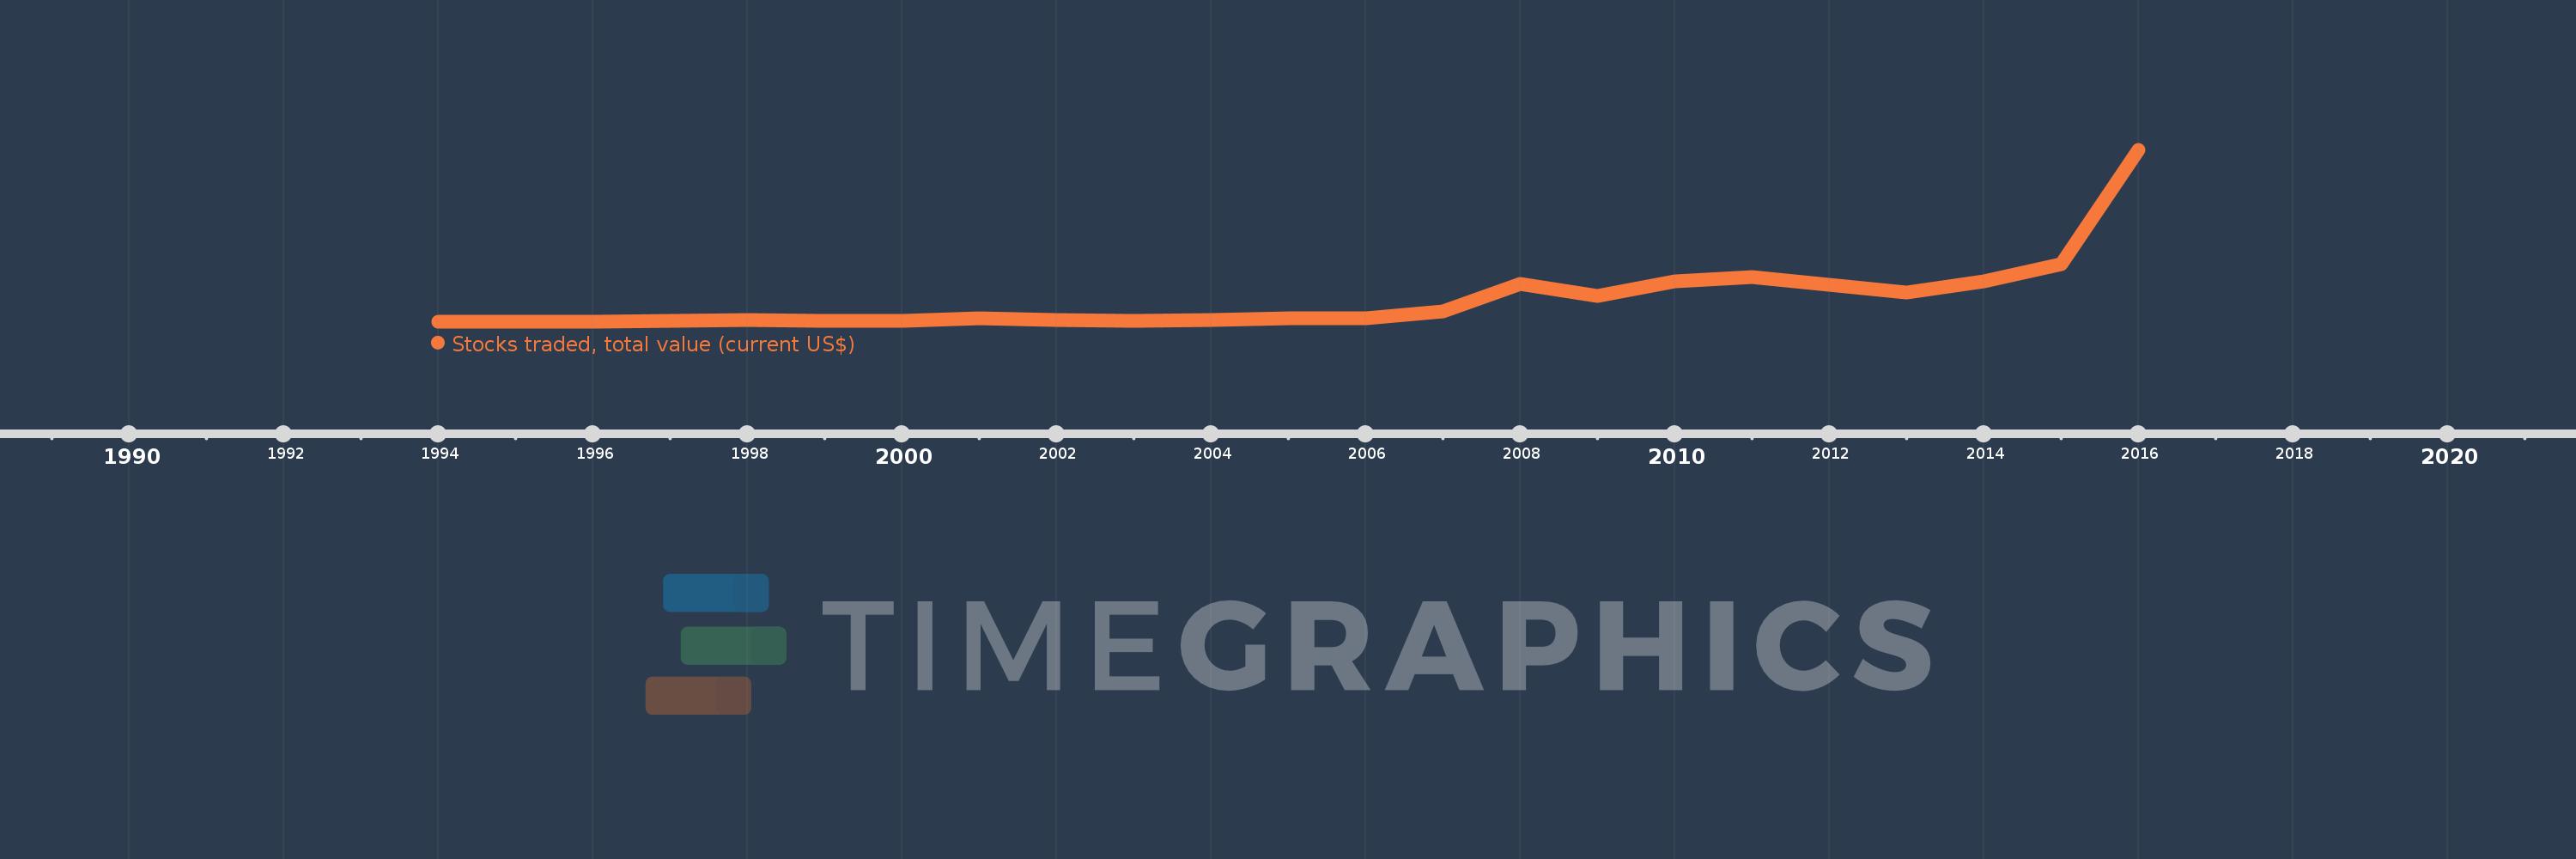
En esta escala de tiempo se presenta un gráfico de 1994 y 2016 de Upper middle income. Los datos de 1993 están ausentes. El número de observaciones reales por fecha: 23.

Fuente (nombre):

Indicadores del desarrollo mundial

Fuente (organización):

World Federation of Exchanges database.

Categorías:

Financial Sector

Se ha actualizado:

23 abr 2017 año

Los indicadores de los cambios de valor en los últimos años

En promedio:
5.678 billones
Mínimo:
318.625 bn
1 ene 1994 año
Máximo:
40.964 billones
1 ene 2016 año
A la fecha de observación
Valor
Cambio absoluto
El cambio con respecto al valor anterior
1 ene 1994 año
318.625 bn
+318.625 bn
0.0%
1 ene 1995 año
456.118 bn
+137.494 bn
43.15%
1 ene 1996 año
415.32 bn
-40.798 bn
-8.94%
1 ene 1997 año
603.602 bn
+188.282 bn
45.33%
1 ene 1998 año
837.173 bn
+233.571 bn
38.7%
1 ene 1999 año
682.043 bn
-155.131 bn
-18.53%
1 ene 2000 año
638.562 bn
-43.481 bn
-6.38%
1 ene 2001 año
1.22 billones
+581.369 bn
91.04%
1 ene 2002 año
774.181 bn
-445.749 bn
-36.54%
1 ene 2003 año
640.577 bn
-133.604 bn
-17.26%
1 ene 2004 año
871.717 bn
+231.139 bn
36.08%
1 ene 2005 año
1.217 billones
+345.489 bn
39.63%
1 ene 2006 año
1.264 billones
+46.786 bn
3.84%
1 ene 2007 año
2.727 billones
+1.463 billones
115.75%
1 ene 2008 año
9.276 billones
+6.549 billones
240.14%
1 ene 2009 año
6.404 billones
-2.872 billones
-30.96%
1 ene 2010 año
9.927 billones
+3.523 billones
55.01%
1 ene 2011 año
10.862 billones
+934.59 bn
9.41%
1 ene 2012 año
9.143 billones
-1.718 billones
-15.82%
1 ene 2013 año
7.33 billones
-1.813 billones
-19.83%
1 ene 2014 año
10.01 billones
+2.681 billones
36.57%
1 ene 2015 año
14.015 billones
+4.004 billones
40.0%
1 ene 2016 año
40.964 billones
+26.95 billones
192.3%

Ranking de los países por los datos estadísticos actuales