33
/es/
AIzaSyAYiBZKx7MnpbEhh9jyipgxe19OcubqV5w
August 1, 2025
225416
Poland
POL
true
2
1
Stocks traded, total value (current US$)
2016,2015,2014,2013,2012,2011,2010,2009,2008,2007,2006,2005,2004,2003,2002,2001,2000,1999,1998,1997,1996,1995,1994,1993,1992
Download
Estadísticas Globales de la Biblioteca →Poland →

Stocks traded, total value (current US$)

Estas estadísticas en otros países:

Arab WorldArgentinaArmeniaAustraliaAustriaBahrainBangladeshBarbadosBelgiumBermudaBoliviaBotswanaBrazilBulgariaCanadaCayman IslandsCentral Europe and the BalticsChannel IslandsChileChinaColombiaCosta RicaCote d'IvoireCroatiaCyprusCzech RepublicDenmarkEarly-demographic dividendEast Asia & PacificEast Asia & Pacific (excluding high income)East Asia & Pacific (IDA & IBRD countries)EcuadorEgypt, Arab Rep.El SalvadorEstoniaEuro areaEurope & Central AsiaEurope & Central Asia (excluding high income)Europe & Central Asia (IDA & IBRD countries)European UnionFijiFinlandFranceGeorgiaGermanyGhanaGreeceGuyanaHigh incomeHong Kong SAR, ChinaHungaryIBRD onlyIcelandIDA & IBRD totalIDA blendIDA totalIndiaIndonesiaIran, Islamic Rep.IrelandIsraelItalyJamaicaJapanJordanKazakhstanKenyaKorea, Rep.KuwaitKyrgyz RepublicLate-demographic dividendLatin America & Caribbean Latin America & Caribbean (excluding high income)Latin America & the Caribbean (IDA & IBRD countries)LatviaLebanonLithuaniaLow & middle incomeLower middle incomeLuxembourgMacedonia, FYRMalawiMalaysiaMaltaMauritiusMexicoMiddle East & North AfricaMiddle East & North Africa (excluding high income)Middle East & North Africa (IDA & IBRD countries)Middle incomeMoldovaMongoliaMontenegroMoroccoNamibiaNetherlandsNew ZealandNigeriaNorth AmericaNorwayOECD membersOmanOther small statesPakistanPanamaPapua New GuineaParaguayPeruPhilippinesPolandPortugalPost-demographic dividendQatarRomaniaRussian FederationSaudi ArabiaSerbiaSeychellesSingaporeSlovak RepublicSloveniaSouth AfricaSouth AsiaSouth Asia (IDA & IBRD)SpainSri LankaSt. Kitts and NevisSub-Saharan Africa Sub-Saharan Africa (excluding high income)Sub-Saharan Africa (IDA & IBRD countries)SwazilandSwedenSwitzerlandTanzaniaThailandTrinidad and TobagoTunisiaTurkeyUgandaUkraineUnited Arab EmiratesUnited KingdomUnited StatesUpper middle incomeUruguayUzbekistanVenezuela, RBVietnamWest Bank and GazaWorldZambiaZimbabwe

línea de tiempo (timeline):

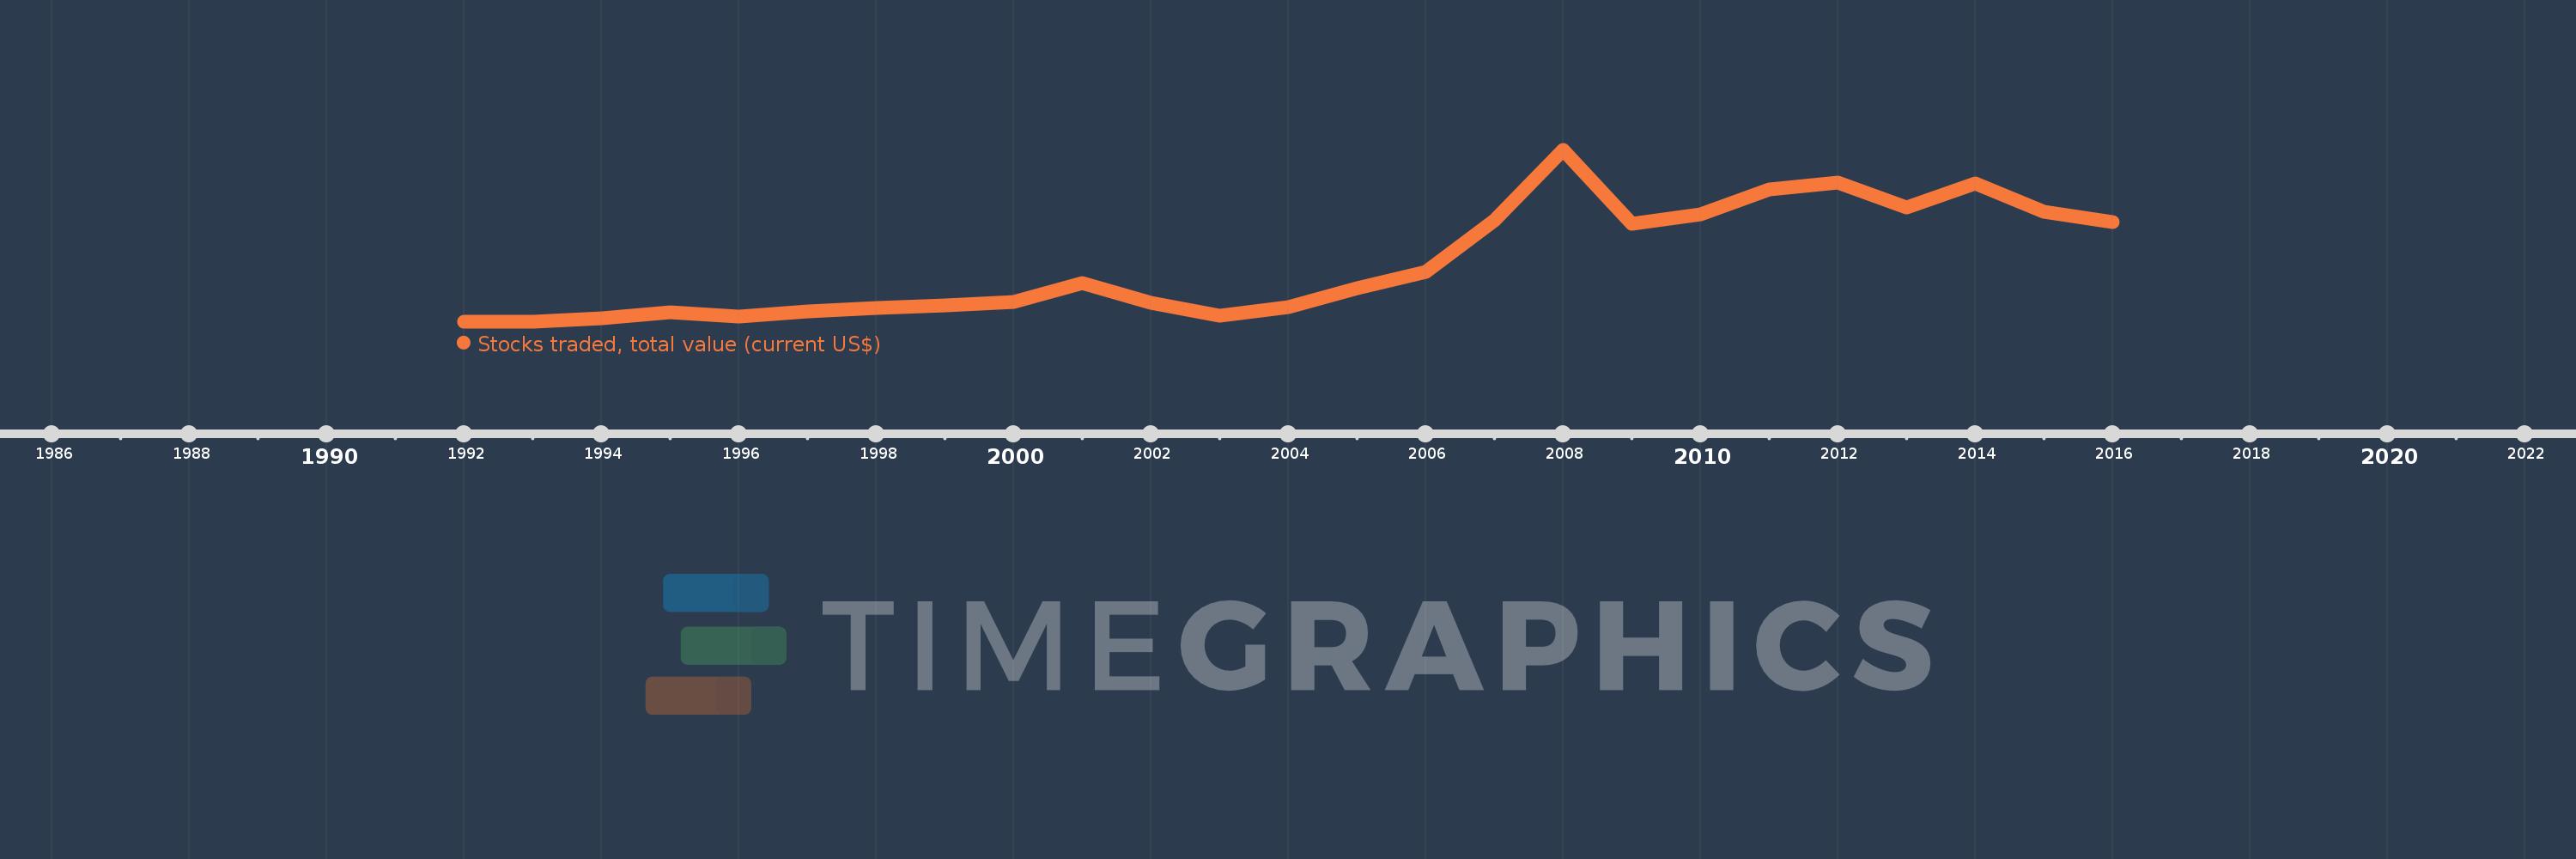
En esta escala de tiempo se presenta un gráfico de 1992 y 2016 de Poland. Los datos de 1991 están ausentes. El número de observaciones reales por fecha: 25.

Fuente (nombre):

Indicadores del desarrollo mundial

Fuente (organización):

World Federation of Exchanges database.

Categorías:

Financial Sector

Se ha actualizado:

23 abr 2017 año

Los indicadores de los cambios de valor en los últimos años

En promedio:
30.649 bn
Mínimo:
83.0 millones
1 ene 1992 año
Máximo:
90.169 bn
1 ene 2008 año
A la fecha de observación
Valor
Cambio absoluto
El cambio con respecto al valor anterior
1 ene 1992 año
83.0 millones
+83.0 millones
0.0%
1 ene 1993 año
417.0 millones
+334.0 millones
402.41%
1 ene 1994 año
1.975 bn
+1.558 bn
373.65%
1 ene 1995 año
5.207 bn
+3.232 bn
163.62%
1 ene 1996 año
2.769 bn
-2.438 bn
-46.82%
1 ene 1997 año
5.544 bn
+2.775 bn
100.2%
1 ene 1998 año
7.425 bn
+1.881 bn
33.93%
1 ene 1999 año
8.873 bn
+1.448 bn
19.51%
1 ene 2000 año
10.745 bn
+1.872 bn
21.1%
1 ene 2001 año
20.46 bn
+9.714 bn
90.4%
1 ene 2002 año
10.177 bn
-10.283 bn
-50.26%
1 ene 2003 año
3.243 bn
-6.934 bn
-68.14%
1 ene 2004 año
7.764 bn
+4.521 bn
139.44%
1 ene 2005 año
17.805 bn
+10.041 bn
129.33%
1 ene 2006 año
26.241 bn
+8.436 bn
47.38%
1 ene 2007 año
53.234 bn
+26.992 bn
102.86%
1 ene 2008 año
90.169 bn
+36.935 bn
69.38%
1 ene 2009 año
51.689 bn
-38.48 bn
-42.68%
1 ene 2010 año
56.628 bn
+4.939 bn
9.56%
1 ene 2011 año
69.439 bn
+12.811 bn
22.62%
1 ene 2012 año
73.064 bn
+3.625 bn
5.22%
1 ene 2013 año
60.228 bn
-12.836 bn
-17.57%
1 ene 2014 año
72.613 bn
+12.384 bn
20.56%
1 ene 2015 año
57.795 bn
-14.818 bn
-20.41%
1 ene 2016 año
52.628 bn
-5.167 bn
-8.94%

Ranking de los países por los datos estadísticos actuales