29
/es/
es
AIzaSyAYiBZKx7MnpbEhh9jyipgxe19OcubqV5w
April 1, 2024
156751
Indonesia
IDN
true
2
1
Stocks traded, total value (current US$)
2016,2015,2014,2013,2012,2011,2010,2009,2008,2007,2006,2005,2004,2003,2002,2001,2000,1999,1998,1997,1996,1995,1994
Download
Estadísticas Globales de la Biblioteca →Indonesia →

Stocks traded, total value (current US$)

Estas estadísticas en otros países:
Arab WorldArgentinaArmeniaAustraliaAustriaBahrainBangladeshBarbadosBelgiumBermudaBoliviaBotswanaBrazilBulgariaCanadaCayman IslandsCentral Europe and the BalticsChannel IslandsChileChinaColombiaCosta RicaCote d'IvoireCroatiaCyprusCzech RepublicDenmarkEarly-demographic dividendEast Asia & PacificEast Asia & Pacific (excluding high income)East Asia & Pacific (IDA & IBRD countries)EcuadorEgypt, Arab Rep.El SalvadorEstoniaEuro areaEurope & Central AsiaEurope & Central Asia (excluding high income)Europe & Central Asia (IDA & IBRD countries)European UnionFijiFinlandFranceGeorgiaGermanyGhanaGreeceGuyanaHigh incomeHong Kong SAR, ChinaHungaryIBRD onlyIcelandIDA & IBRD totalIDA blendIDA totalIndiaIndonesiaIran, Islamic Rep.IrelandIsraelItalyJamaicaJapanJordanKazakhstanKenyaKorea, Rep.KuwaitKyrgyz RepublicLate-demographic dividendLatin America & Caribbean Latin America & Caribbean (excluding high income)Latin America & the Caribbean (IDA & IBRD countries)LatviaLebanonLithuaniaLow & middle incomeLower middle incomeLuxembourgMacedonia, FYRMalawiMalaysiaMaltaMauritiusMexicoMiddle East & North AfricaMiddle East & North Africa (excluding high income)Middle East & North Africa (IDA & IBRD countries)Middle incomeMoldovaMongoliaMontenegroMoroccoNamibiaNetherlandsNew ZealandNigeriaNorth AmericaNorwayOECD membersOmanOther small statesPakistanPanamaPapua New GuineaParaguayPeruPhilippinesPolandPortugalPost-demographic dividendQatarRomaniaRussian FederationSaudi ArabiaSerbiaSeychellesSingaporeSlovak RepublicSloveniaSouth AfricaSouth AsiaSouth Asia (IDA & IBRD)SpainSri LankaSt. Kitts and NevisSub-Saharan Africa Sub-Saharan Africa (excluding high income)Sub-Saharan Africa (IDA & IBRD countries)SwazilandSwedenSwitzerlandTanzaniaThailandTrinidad and TobagoTunisiaTurkeyUgandaUkraineUnited Arab EmiratesUnited KingdomUnited StatesUpper middle incomeUruguayUzbekistanVenezuela, RBVietnamWest Bank and GazaWorldZambiaZimbabwe
línea de tiempo (timeline):
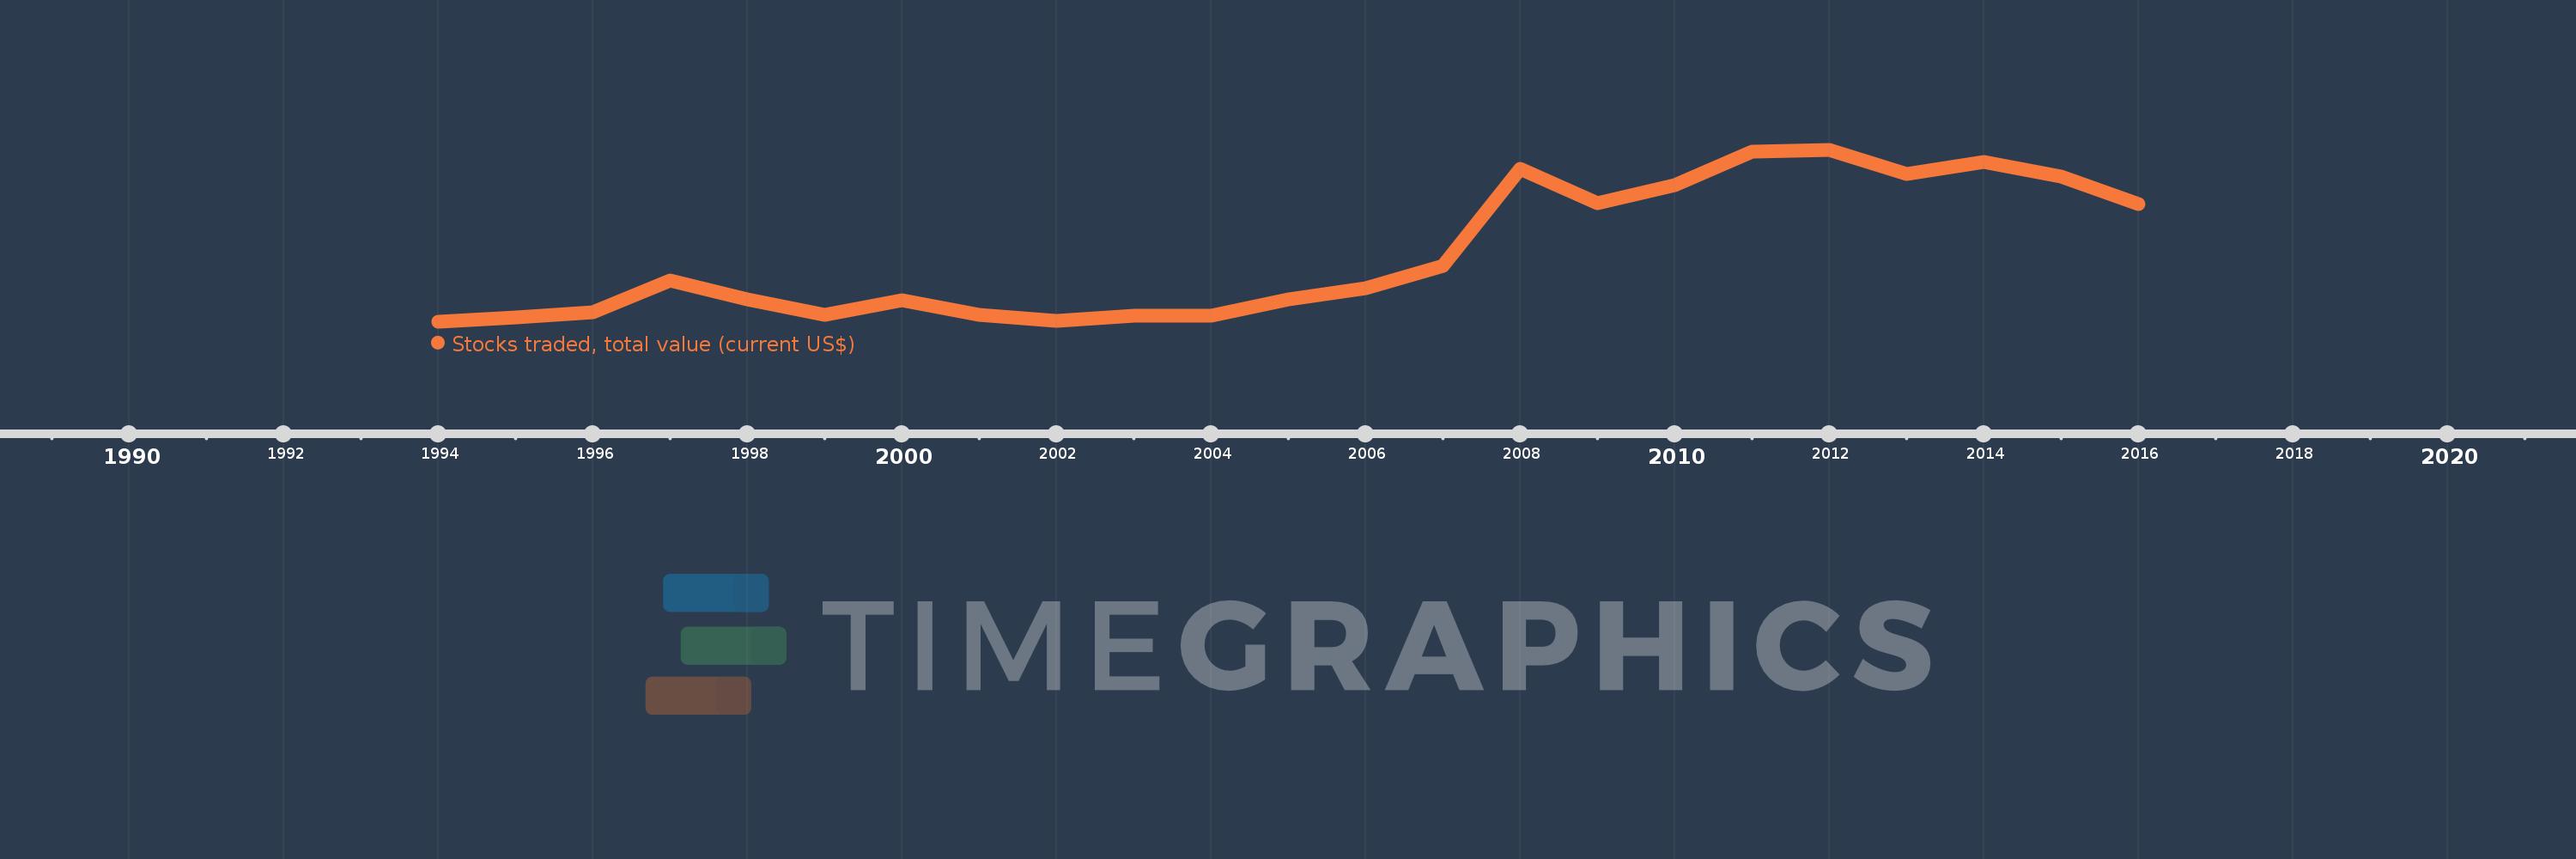
En esta escala de tiempo se presenta un gráfico de 1994 y 2016 de Indonesia. Los datos de 1993 están ausentes. El número de observaciones reales por fecha: 23.
Fuente (nombre):
Indicadores del desarrollo mundial
Fuente (organización):
World Federation of Exchanges database.
Categorías:
Financial Sector
Se ha actualizado:
23 abr 2017 año
Los indicadores de los cambios de valor en los últimos años
En promedio:
47.167 bn
Mínimo:
9.088 bn
1 ene 1994 año
Máximo:
105.475 bn
1 ene 2012 año
A la fecha de observación
Valor
Cambio absoluto
El cambio con respecto al valor anterior
1 ene 1994 año
9.088 bn
+9.088 bn
0.0%
1 ene 1995 año
11.787 bn
+2.699 bn
29.7%
1 ene 1996 año
14.375 bn
+2.587 bn
21.95%
1 ene 1997 año
32.439 bn
+18.064 bn
125.67%
1 ene 1998 año
21.995 bn
-10.444 bn
-32.2%
1 ene 1999 año
12.931 bn
-9.064 bn
-41.21%
1 ene 2000 año
21.162 bn
+8.231 bn
63.65%
1 ene 2001 año
12.902 bn
-8.26 bn
-39.03%
1 ene 2002 año
9.638 bn
-3.264 bn
-25.3%
1 ene 2003 año
12.388 bn
+2.75 bn
28.53%
1 ene 2004 año
12.76 bn
+372.71 millones
3.01%
1 ene 2005 año
21.879 bn
+9.118 bn
71.46%
1 ene 2006 año
27.859 bn
+5.98 bn
27.33%
1 ene 2007 año
40.323 bn
+12.464 bn
44.74%
1 ene 2008 año
94.914 bn
+54.591 bn
135.38%
1 ene 2009 año
75.849 bn
-19.065 bn
-20.09%
1 ene 2010 año
86.073 bn
+10.224 bn
13.48%
1 ene 2011 año
104.452 bn
+18.379 bn
21.35%
1 ene 2012 año
105.475 bn
+1.023 bn
0.98%
1 ene 2013 año
91.929 bn
-13.546 bn
-12.84%
1 ene 2014 año
98.858 bn
+6.928 bn
7.54%
1 ene 2015 año
90.721 bn
-8.136 bn
-8.23%
1 ene 2016 año
75.045 bn
-15.676 bn
-17.28%
Ranking de los países por los datos estadísticos actuales

Comentarios:

Enviar
PremiumAbout & FeedbackAcuerdoPrivacidad
logo
© 2022 Selected Technologies LLC – Morgan Hill, California