33
/es/
AIzaSyAYiBZKx7MnpbEhh9jyipgxe19OcubqV5w
May 1, 2025
217182
Pakistan
PAK
true
2
1
Stocks traded, total value (current US$)
2015,2014,2013,2012,2011,2010,2009,2008,2007,2006,2005,2002,2001,2000,1999,1998,1997,1996,1995,1994
Download
Estadísticas Globales de la Biblioteca →Pakistan →

Stocks traded, total value (current US$)

Estas estadísticas en otros países:

Arab WorldArgentinaArmeniaAustraliaAustriaBahrainBangladeshBarbadosBelgiumBermudaBoliviaBotswanaBrazilBulgariaCanadaCayman IslandsCentral Europe and the BalticsChannel IslandsChileChinaColombiaCosta RicaCote d'IvoireCroatiaCyprusCzech RepublicDenmarkEarly-demographic dividendEast Asia & PacificEast Asia & Pacific (excluding high income)East Asia & Pacific (IDA & IBRD countries)EcuadorEgypt, Arab Rep.El SalvadorEstoniaEuro areaEurope & Central AsiaEurope & Central Asia (excluding high income)Europe & Central Asia (IDA & IBRD countries)European UnionFijiFinlandFranceGeorgiaGermanyGhanaGreeceGuyanaHigh incomeHong Kong SAR, ChinaHungaryIBRD onlyIcelandIDA & IBRD totalIDA blendIDA totalIndiaIndonesiaIran, Islamic Rep.IrelandIsraelItalyJamaicaJapanJordanKazakhstanKenyaKorea, Rep.KuwaitKyrgyz RepublicLate-demographic dividendLatin America & Caribbean Latin America & Caribbean (excluding high income)Latin America & the Caribbean (IDA & IBRD countries)LatviaLebanonLithuaniaLow & middle incomeLower middle incomeLuxembourgMacedonia, FYRMalawiMalaysiaMaltaMauritiusMexicoMiddle East & North AfricaMiddle East & North Africa (excluding high income)Middle East & North Africa (IDA & IBRD countries)Middle incomeMoldovaMongoliaMontenegroMoroccoNamibiaNetherlandsNew ZealandNigeriaNorth AmericaNorwayOECD membersOmanOther small statesPakistanPanamaPapua New GuineaParaguayPeruPhilippinesPolandPortugalPost-demographic dividendQatarRomaniaRussian FederationSaudi ArabiaSerbiaSeychellesSingaporeSlovak RepublicSloveniaSouth AfricaSouth AsiaSouth Asia (IDA & IBRD)SpainSri LankaSt. Kitts and NevisSub-Saharan Africa Sub-Saharan Africa (excluding high income)Sub-Saharan Africa (IDA & IBRD countries)SwazilandSwedenSwitzerlandTanzaniaThailandTrinidad and TobagoTunisiaTurkeyUgandaUkraineUnited Arab EmiratesUnited KingdomUnited StatesUpper middle incomeUruguayUzbekistanVenezuela, RBVietnamWest Bank and GazaWorldZambiaZimbabwe

línea de tiempo (timeline):

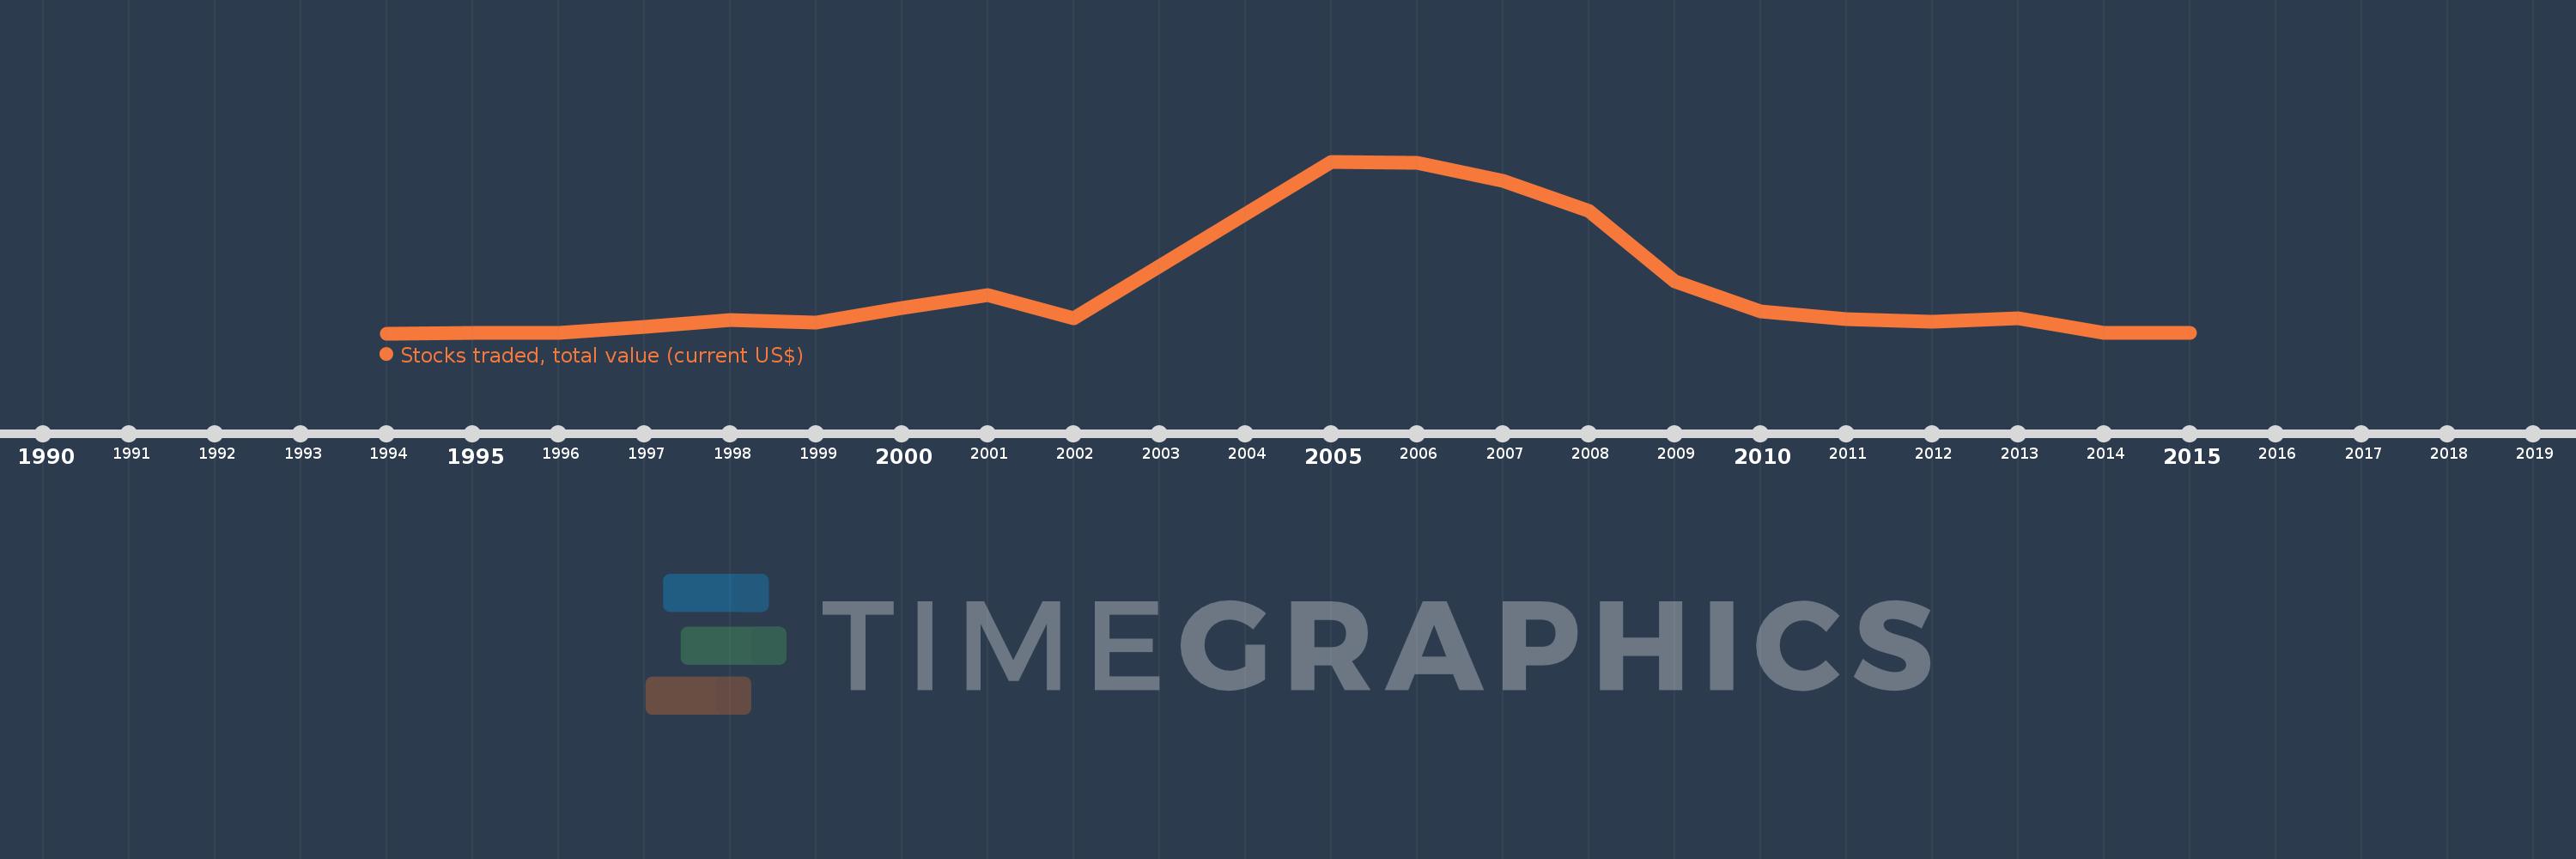
En esta escala de tiempo se presenta un gráfico de 1994 y 2015 de Pakistan. Los datos de 1993 están ausentes. El número de observaciones reales por fecha: 20.

Fuente (nombre):

Indicadores del desarrollo mundial

Fuente (organización):

World Federation of Exchanges database.

Categorías:

Financial Sector

Se ha actualizado:

23 abr 2017 año

Los indicadores de los cambios de valor en los últimos años

En promedio:
34.414 bn
Mínimo:
42.4 millones
1 ene 1994 año
Máximo:
140.293 bn
1 ene 2005 año
A la fecha de observación
Valor
Cambio absoluto
El cambio con respecto al valor anterior
1 ene 1994 año
42.4 millones
+42.4 millones
0.0%
1 ene 1995 año
60.6 millones
+18.2 millones
42.92%
1 ene 1996 año
159.21 millones
+98.61 millones
162.72%
1 ene 1997 año
5.561 bn
+5.401 bn
3.39 mil%
1 ene 1998 año
10.563 bn
+5.002 bn
89.96%
1 ene 1999 año
8.99 bn
-1.573 bn
-14.89%
1 ene 2000 año
20.824 bn
+11.834 bn
131.64%
1 ene 2001 año
31.0 bn
+10.176 bn
48.86%
1 ene 2002 año
12.453 bn
-18.547 bn
-59.83%
1 ene 2005 año
140.293 bn
+127.84 bn
1.03 mil%
1 ene 2006 año
139.436 bn
-856.45 millones
-0.61%
1 ene 2007 año
124.831 bn
-14.606 bn
-10.47%
1 ene 2008 año
99.832 bn
-24.999 bn
-20.03%
1 ene 2009 año
42.28 bn
-57.552 bn
-57.65%
1 ene 2010 año
17.593 bn
-24.687 bn
-58.39%
1 ene 2011 año
11.654 bn
-5.94 bn
-33.76%
1 ene 2012 año
9.638 bn
-2.016 bn
-17.3%
1 ene 2013 año
11.976 bn
+2.338 bn
24.26%
1 ene 2014 año
562.9 millones
-11.413 bn
-95.3%
1 ene 2015 año
539.7 millones
-23.2 millones
-4.12%

Ranking de los países por los datos estadísticos actuales