33
/es/
AIzaSyAYiBZKx7MnpbEhh9jyipgxe19OcubqV5w
August 1, 2025
227902
Qatar
QAT
true
2
1
Stocks traded, total value (current US$)
2016,2015,2014,2013,2012,2011,2010,2009,2008,2007
Download
Estadísticas Globales de la Biblioteca →Qatar →

Stocks traded, total value (current US$)

Estas estadísticas en otros países:

Arab WorldArgentinaArmeniaAustraliaAustriaBahrainBangladeshBarbadosBelgiumBermudaBoliviaBotswanaBrazilBulgariaCanadaCayman IslandsCentral Europe and the BalticsChannel IslandsChileChinaColombiaCosta RicaCote d'IvoireCroatiaCyprusCzech RepublicDenmarkEarly-demographic dividendEast Asia & PacificEast Asia & Pacific (excluding high income)East Asia & Pacific (IDA & IBRD countries)EcuadorEgypt, Arab Rep.El SalvadorEstoniaEuro areaEurope & Central AsiaEurope & Central Asia (excluding high income)Europe & Central Asia (IDA & IBRD countries)European UnionFijiFinlandFranceGeorgiaGermanyGhanaGreeceGuyanaHigh incomeHong Kong SAR, ChinaHungaryIBRD onlyIcelandIDA & IBRD totalIDA blendIDA totalIndiaIndonesiaIran, Islamic Rep.IrelandIsraelItalyJamaicaJapanJordanKazakhstanKenyaKorea, Rep.KuwaitKyrgyz RepublicLate-demographic dividendLatin America & Caribbean Latin America & Caribbean (excluding high income)Latin America & the Caribbean (IDA & IBRD countries)LatviaLebanonLithuaniaLow & middle incomeLower middle incomeLuxembourgMacedonia, FYRMalawiMalaysiaMaltaMauritiusMexicoMiddle East & North AfricaMiddle East & North Africa (excluding high income)Middle East & North Africa (IDA & IBRD countries)Middle incomeMoldovaMongoliaMontenegroMoroccoNamibiaNetherlandsNew ZealandNigeriaNorth AmericaNorwayOECD membersOmanOther small statesPakistanPanamaPapua New GuineaParaguayPeruPhilippinesPolandPortugalPost-demographic dividendQatarRomaniaRussian FederationSaudi ArabiaSerbiaSeychellesSingaporeSlovak RepublicSloveniaSouth AfricaSouth AsiaSouth Asia (IDA & IBRD)SpainSri LankaSt. Kitts and NevisSub-Saharan Africa Sub-Saharan Africa (excluding high income)Sub-Saharan Africa (IDA & IBRD countries)SwazilandSwedenSwitzerlandTanzaniaThailandTrinidad and TobagoTunisiaTurkeyUgandaUkraineUnited Arab EmiratesUnited KingdomUnited StatesUpper middle incomeUruguayUzbekistanVenezuela, RBVietnamWest Bank and GazaWorldZambiaZimbabwe

línea de tiempo (timeline):

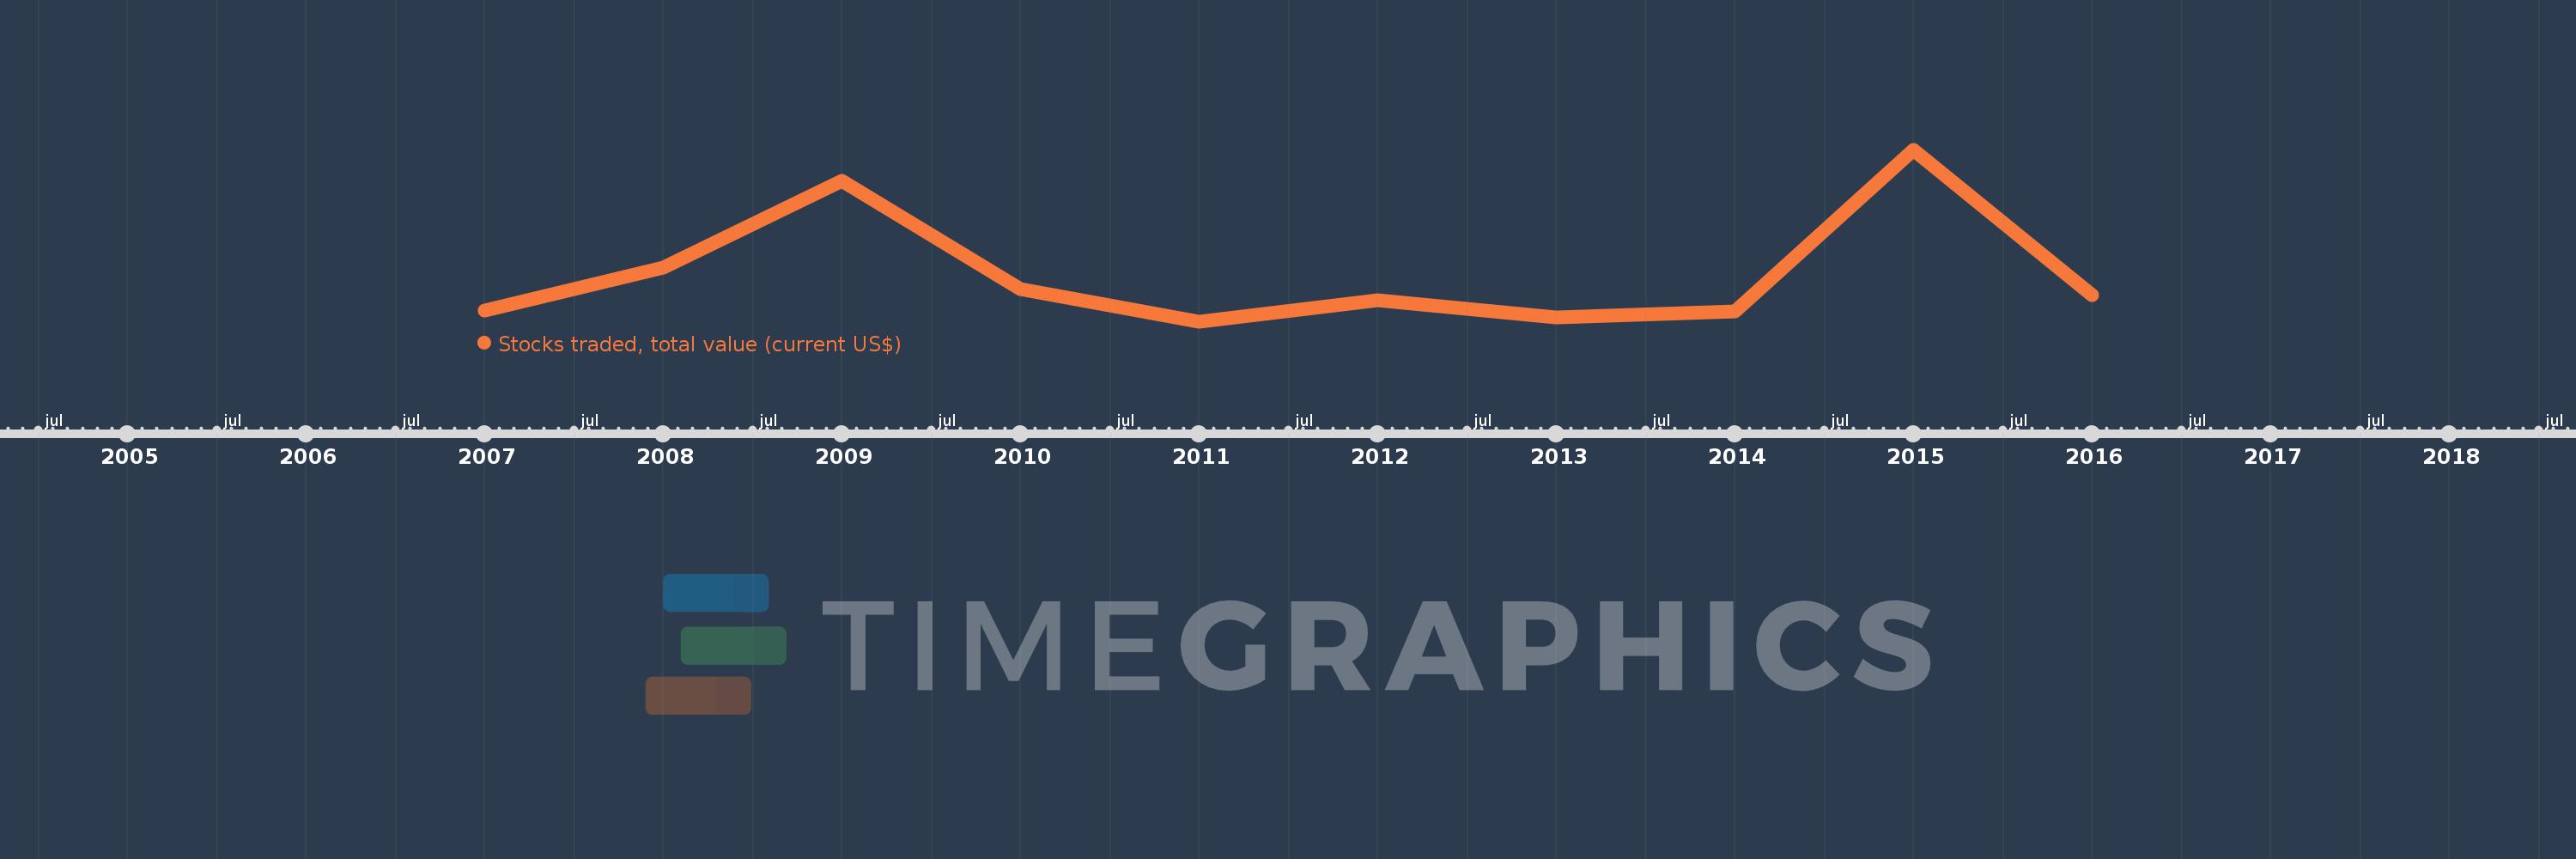
En esta escala de tiempo se presenta un gráfico de 2007 y 2016 de Qatar. Los datos de 2006 están ausentes. El número de observaciones reales por fecha: 10.

Fuente (nombre):

Indicadores del desarrollo mundial

Fuente (organización):

World Federation of Exchanges database.

Categorías:

Financial Sector

Se ha actualizado:

23 abr 2017 año

Los indicadores de los cambios de valor en los últimos años

En promedio:
28.437 bn
Mínimo:
18.401 bn
1 ene 2011 año
Máximo:
54.73 bn
1 ene 2015 año
A la fecha de observación
Valor
Cambio absoluto
El cambio con respecto al valor anterior
1 ene 2007 año
20.754 bn
+20.754 bn
0.0%
1 ene 2008 año
29.94 bn
+9.186 bn
44.26%
1 ene 2009 año
48.186 bn
+18.246 bn
60.94%
1 ene 2010 año
25.319 bn
-22.867 bn
-47.46%
1 ene 2011 año
18.401 bn
-6.918 bn
-27.32%
1 ene 2012 año
22.909 bn
+4.507 bn
24.49%
1 ene 2013 año
19.41 bn
-3.499 bn
-15.27%
1 ene 2014 año
20.565 bn
+1.155 bn
5.95%
1 ene 2015 año
54.73 bn
+34.165 bn
166.14%
1 ene 2016 año
24.152 bn
-30.578 bn
-55.87%

Ranking de los países por los datos estadísticos actuales