33
/es/
AIzaSyAYiBZKx7MnpbEhh9jyipgxe19OcubqV5w
August 1, 2025
159919
Ireland
IRL
true
2
1
Stocks traded, total value (current US$)
2016,2015,2014,2013,2012,2011,2010,2009,2008,2007,2006,2005,2004,2003,2002,2001,2000,1999,1998,1997,1996
Download
Estadísticas Globales de la Biblioteca →Ireland →

Stocks traded, total value (current US$)

Estas estadísticas en otros países:

Arab WorldArgentinaArmeniaAustraliaAustriaBahrainBangladeshBarbadosBelgiumBermudaBoliviaBotswanaBrazilBulgariaCanadaCayman IslandsCentral Europe and the BalticsChannel IslandsChileChinaColombiaCosta RicaCote d'IvoireCroatiaCyprusCzech RepublicDenmarkEarly-demographic dividendEast Asia & PacificEast Asia & Pacific (excluding high income)East Asia & Pacific (IDA & IBRD countries)EcuadorEgypt, Arab Rep.El SalvadorEstoniaEuro areaEurope & Central AsiaEurope & Central Asia (excluding high income)Europe & Central Asia (IDA & IBRD countries)European UnionFijiFinlandFranceGeorgiaGermanyGhanaGreeceGuyanaHigh incomeHong Kong SAR, ChinaHungaryIBRD onlyIcelandIDA & IBRD totalIDA blendIDA totalIndiaIndonesiaIran, Islamic Rep.IrelandIsraelItalyJamaicaJapanJordanKazakhstanKenyaKorea, Rep.KuwaitKyrgyz RepublicLate-demographic dividendLatin America & Caribbean Latin America & Caribbean (excluding high income)Latin America & the Caribbean (IDA & IBRD countries)LatviaLebanonLithuaniaLow & middle incomeLower middle incomeLuxembourgMacedonia, FYRMalawiMalaysiaMaltaMauritiusMexicoMiddle East & North AfricaMiddle East & North Africa (excluding high income)Middle East & North Africa (IDA & IBRD countries)Middle incomeMoldovaMongoliaMontenegroMoroccoNamibiaNetherlandsNew ZealandNigeriaNorth AmericaNorwayOECD membersOmanOther small statesPakistanPanamaPapua New GuineaParaguayPeruPhilippinesPolandPortugalPost-demographic dividendQatarRomaniaRussian FederationSaudi ArabiaSerbiaSeychellesSingaporeSlovak RepublicSloveniaSouth AfricaSouth AsiaSouth Asia (IDA & IBRD)SpainSri LankaSt. Kitts and NevisSub-Saharan Africa Sub-Saharan Africa (excluding high income)Sub-Saharan Africa (IDA & IBRD countries)SwazilandSwedenSwitzerlandTanzaniaThailandTrinidad and TobagoTunisiaTurkeyUgandaUkraineUnited Arab EmiratesUnited KingdomUnited StatesUpper middle incomeUruguayUzbekistanVenezuela, RBVietnamWest Bank and GazaWorldZambiaZimbabwe

línea de tiempo (timeline):

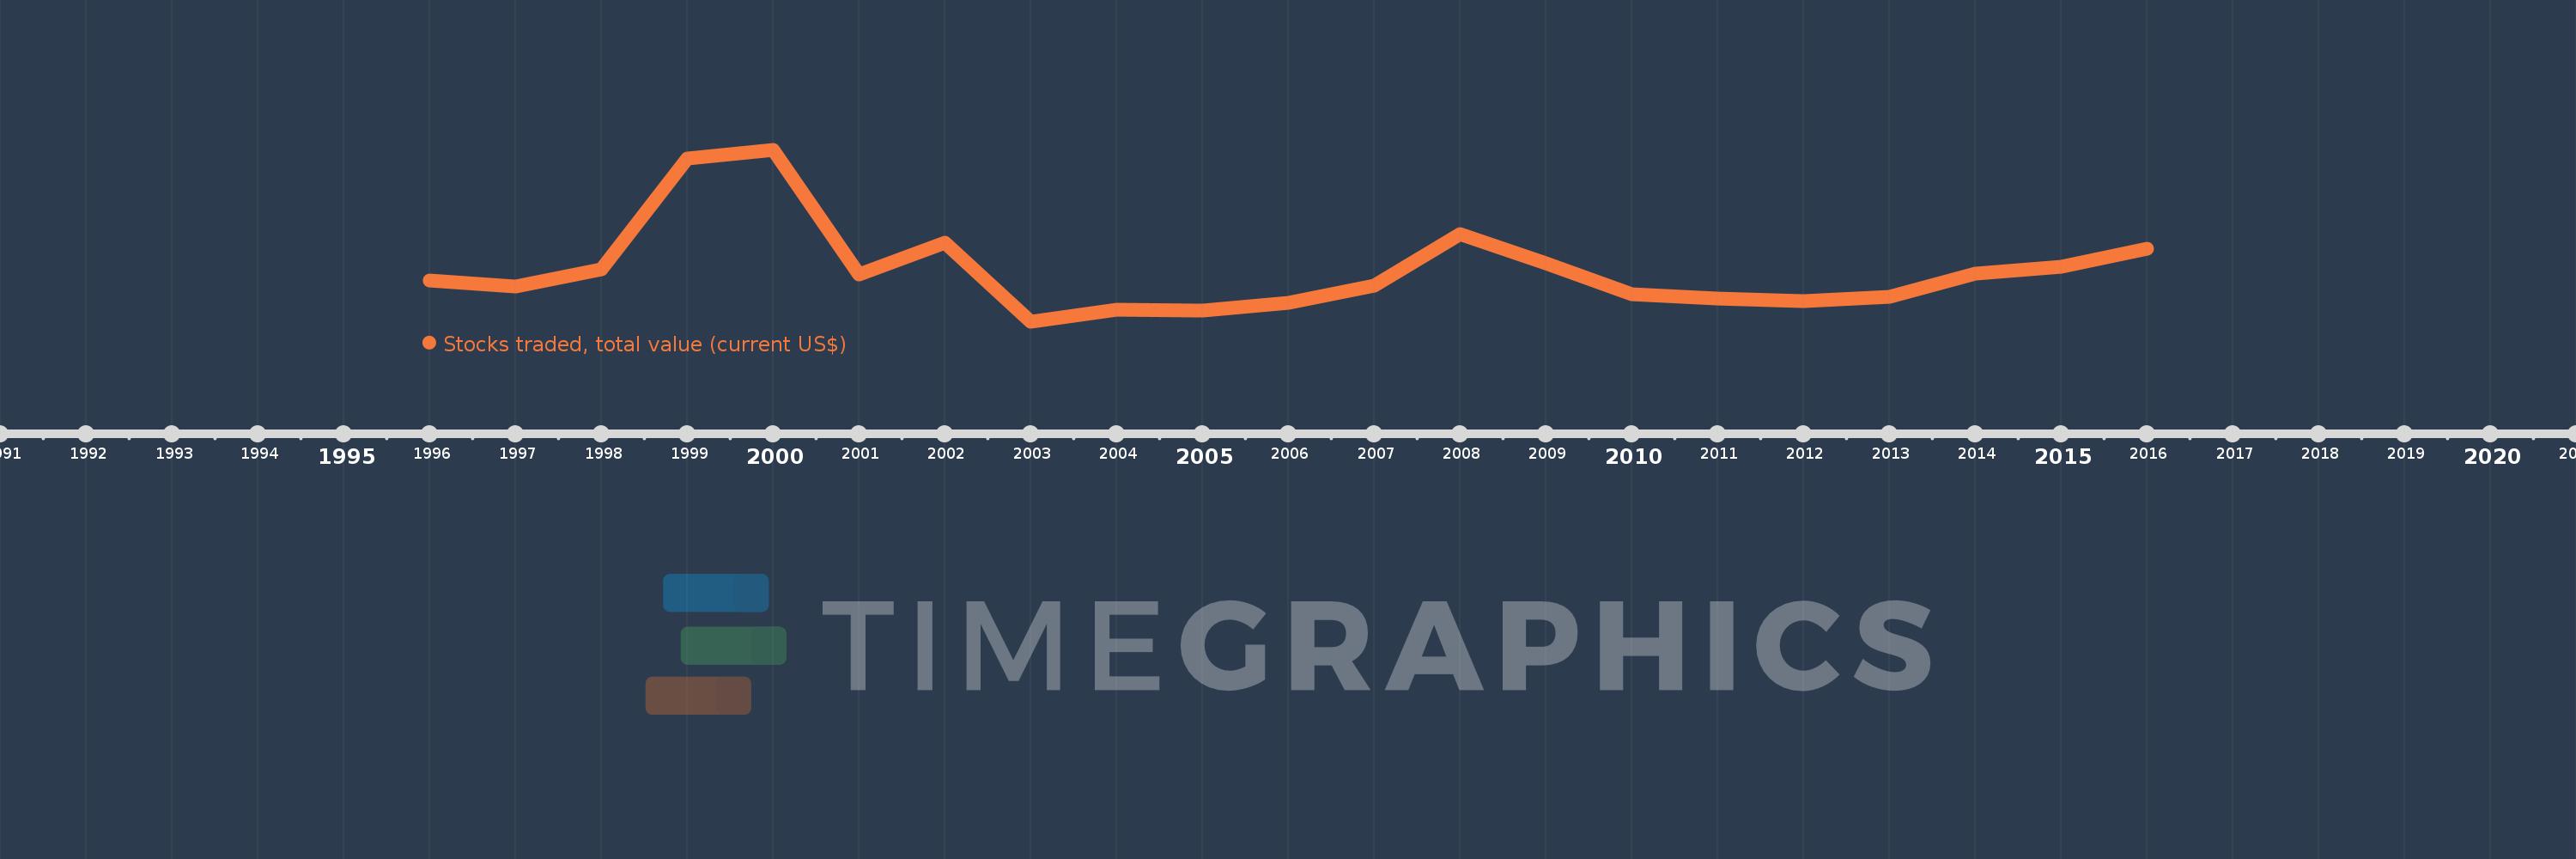
En esta escala de tiempo se presenta un gráfico de 1996 y 2016 de Ireland. Los datos de 1995 están ausentes. El número de observaciones reales por fecha: 21.

Fuente (nombre):

Indicadores del desarrollo mundial

Fuente (organización):

World Federation of Exchanges database.

Categorías:

Financial Sector

Se ha actualizado:

23 abr 2017 año

Los indicadores de los cambios de valor en los últimos años

En promedio:
15.835 bn
Mínimo:
3.14 bn
1 ene 2003 año
Máximo:
45.081 bn
1 ene 2000 año
A la fecha de observación
Valor
Cambio absoluto
El cambio con respecto al valor anterior
1 ene 1996 año
13.327 bn
+13.327 bn
0.0%
1 ene 1997 año
11.794 bn
-1.533 bn
-11.5%
1 ene 1998 año
16.003 bn
+4.209 bn
35.69%
1 ene 1999 año
43.1 bn
+27.096 bn
169.32%
1 ene 2000 año
45.081 bn
+1.981 bn
4.6%
1 ene 2001 año
14.714 bn
-30.367 bn
-67.36%
1 ene 2002 año
22.484 bn
+7.77 bn
52.81%
1 ene 2003 año
3.14 bn
-19.345 bn
-86.04%
1 ene 2004 año
6.104 bn
+2.964 bn
94.41%
1 ene 2005 año
5.977 bn
-126.63 millones
-2.07%
1 ene 2006 año
7.806 bn
+1.829 bn
30.6%
1 ene 2007 año
12.08 bn
+4.274 bn
54.75%
1 ene 2008 año
24.661 bn
+12.581 bn
104.15%
1 ene 2009 año
17.562 bn
-7.099 bn
-28.79%
1 ene 2010 año
9.881 bn
-7.681 bn
-43.74%
1 ene 2011 año
8.87 bn
-1.011 bn
-10.24%
1 ene 2012 año
8.171 bn
-698.23 millones
-7.87%
1 ene 2013 año
9.374 bn
+1.203 bn
14.72%
1 ene 2014 año
14.901 bn
+5.527 bn
58.96%
1 ene 2015 año
16.574 bn
+1.673 bn
11.23%
1 ene 2016 año
20.929 bn
+4.356 bn
26.28%

Ranking de los países por los datos estadísticos actuales