33
/es/
AIzaSyAYiBZKx7MnpbEhh9jyipgxe19OcubqV5w
August 1, 2025
37809
IDA & IBRD total
IBT
false
2
1
Stocks traded, total value (current US$)
2016,2015,2014,2013,2012,2011,2010,2009,2008,2007,2006,2005,2004,2003,2002,2001,2000,1999,1998,1997,1996,1995,1994
Download
Estadísticas Globales de la Biblioteca →IDA & IBRD total →

Stocks traded, total value (current US$)

Estas estadísticas en otros países:

Arab WorldArgentinaArmeniaAustraliaAustriaBahrainBangladeshBarbadosBelgiumBermudaBoliviaBotswanaBrazilBulgariaCanadaCayman IslandsCentral Europe and the BalticsChannel IslandsChileChinaColombiaCosta RicaCote d'IvoireCroatiaCyprusCzech RepublicDenmarkEarly-demographic dividendEast Asia & PacificEast Asia & Pacific (excluding high income)East Asia & Pacific (IDA & IBRD countries)EcuadorEgypt, Arab Rep.El SalvadorEstoniaEuro areaEurope & Central AsiaEurope & Central Asia (excluding high income)Europe & Central Asia (IDA & IBRD countries)European UnionFijiFinlandFranceGeorgiaGermanyGhanaGreeceGuyanaHigh incomeHong Kong SAR, ChinaHungaryIBRD onlyIcelandIDA & IBRD totalIDA blendIDA totalIndiaIndonesiaIran, Islamic Rep.IrelandIsraelItalyJamaicaJapanJordanKazakhstanKenyaKorea, Rep.KuwaitKyrgyz RepublicLate-demographic dividendLatin America & Caribbean Latin America & Caribbean (excluding high income)Latin America & the Caribbean (IDA & IBRD countries)LatviaLebanonLithuaniaLow & middle incomeLower middle incomeLuxembourgMacedonia, FYRMalawiMalaysiaMaltaMauritiusMexicoMiddle East & North AfricaMiddle East & North Africa (excluding high income)Middle East & North Africa (IDA & IBRD countries)Middle incomeMoldovaMongoliaMontenegroMoroccoNamibiaNetherlandsNew ZealandNigeriaNorth AmericaNorwayOECD membersOmanOther small statesPakistanPanamaPapua New GuineaParaguayPeruPhilippinesPolandPortugalPost-demographic dividendQatarRomaniaRussian FederationSaudi ArabiaSerbiaSeychellesSingaporeSlovak RepublicSloveniaSouth AfricaSouth AsiaSouth Asia (IDA & IBRD)SpainSri LankaSt. Kitts and NevisSub-Saharan Africa Sub-Saharan Africa (excluding high income)Sub-Saharan Africa (IDA & IBRD countries)SwazilandSwedenSwitzerlandTanzaniaThailandTrinidad and TobagoTunisiaTurkeyUgandaUkraineUnited Arab EmiratesUnited KingdomUnited StatesUpper middle incomeUruguayUzbekistanVenezuela, RBVietnamWest Bank and GazaWorldZambiaZimbabwe

línea de tiempo (timeline):

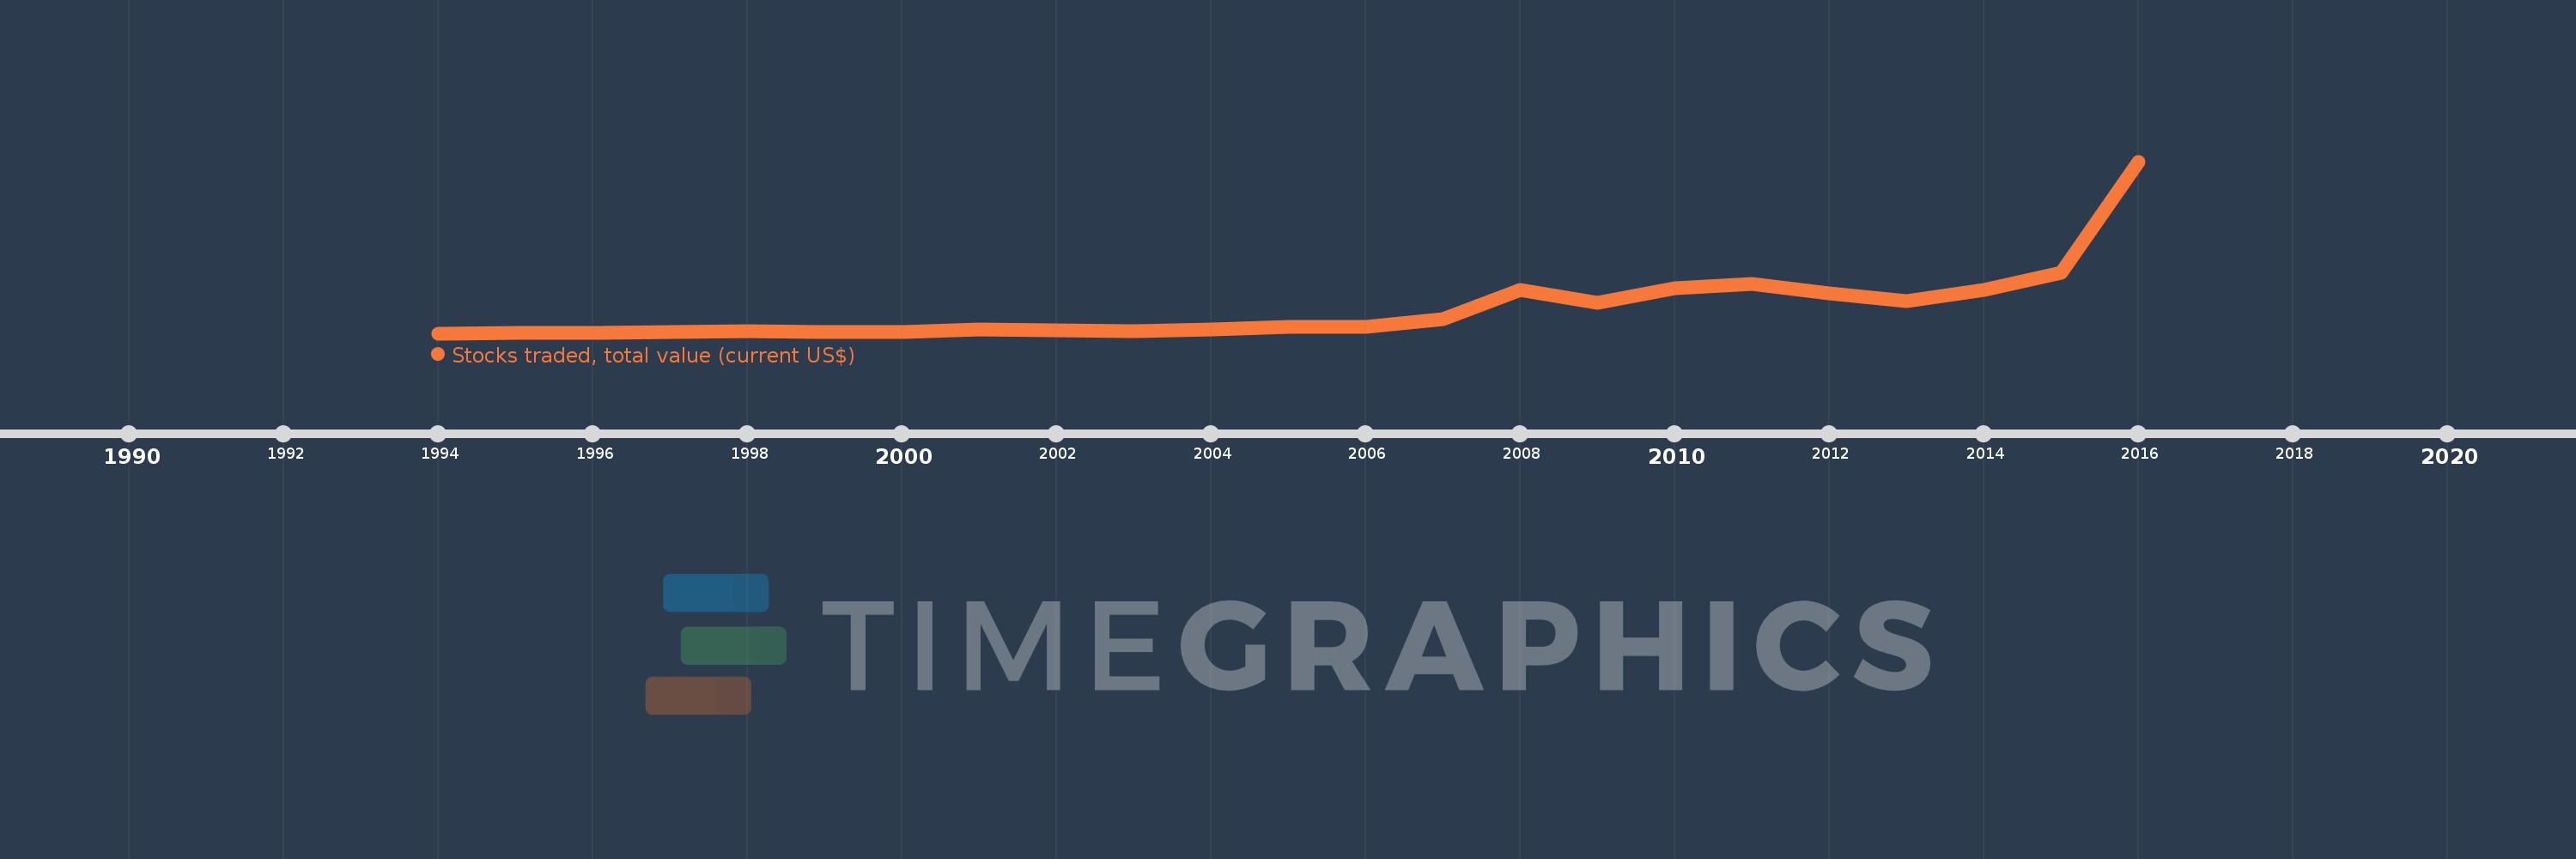
En esta escala de tiempo se presenta un gráfico de 1994 y 2016 de IDA & IBRD total. Los datos de 1993 están ausentes. El número de observaciones reales por fecha: 23.

Fuente (nombre):

Indicadores del desarrollo mundial

Fuente (organización):

World Federation of Exchanges database.

Categorías:

Financial Sector

Se ha actualizado:

23 abr 2017 año

Los indicadores de los cambios de valor en los últimos años

En promedio:
6.281 billones
Mínimo:
339.96 bn
1 ene 1994 año
Máximo:
41.965 billones
1 ene 2016 año
A la fecha de observación
Valor
Cambio absoluto
El cambio con respecto al valor anterior
1 ene 1994 año
339.96 bn
+339.96 bn
0.0%
1 ene 1995 año
494.689 bn
+154.729 bn
45.51%
1 ene 1996 año
462.355 bn
-32.334 bn
-6.54%
1 ene 1997 año
678.218 bn
+215.863 bn
46.69%
1 ene 1998 año
918.099 bn
+239.881 bn
35.37%
1 ene 1999 año
742.281 bn
-175.818 bn
-19.15%
1 ene 2000 año
727.4 bn
-14.882 bn
-2.0%
1 ene 2001 año
1.324 billones
+596.793 bn
82.04%
1 ene 2002 año
968.143 bn
-356.049 bn
-26.89%
1 ene 2003 año
791.152 bn
-176.991 bn
-18.28%
1 ene 2004 año
1.178 billones
+387.048 bn
48.92%
1 ene 2005 año
1.814 billones
+635.999 bn
53.98%
1 ene 2006 año
1.96 billones
+145.655 bn
8.03%
1 ene 2007 año
3.701 billones
+1.741 billones
88.84%
1 ene 2008 año
10.884 billones
+7.183 billones
194.07%
1 ene 2009 año
7.682 billones
-3.202 billones
-29.42%
1 ene 2010 año
11.345 billones
+3.663 billones
47.68%
1 ene 2011 año
12.293 billones
+948.416 bn
8.36%
1 ene 2012 año
10.099 billones
-2.194 billones
-17.85%
1 ene 2013 año
8.224 billones
-1.875 billones
-18.56%
1 ene 2014 año
10.845 billones
+2.621 billones
31.87%
1 ene 2015 año
15.024 billones
+4.179 billones
38.53%
1 ene 2016 año
41.965 billones
+26.94 billones
179.31%

Ranking de los países por los datos estadísticos actuales