29
/es/
es
AIzaSyAYiBZKx7MnpbEhh9jyipgxe19OcubqV5w
April 1, 2024
222945
Peru
PER
true
2
1
Stocks traded, total value (current US$)
2016,2015,2014,2013,2012,2011,2010,2009,2008,2007,2006,2005,2004,2003,2002,2001,2000,1999,1998,1997,1996,1995,1994
Download
Estadísticas Globales de la Biblioteca →Peru →

Stocks traded, total value (current US$)

Estas estadísticas en otros países:
Arab WorldArgentinaArmeniaAustraliaAustriaBahrainBangladeshBarbadosBelgiumBermudaBoliviaBotswanaBrazilBulgariaCanadaCayman IslandsCentral Europe and the BalticsChannel IslandsChileChinaColombiaCosta RicaCote d'IvoireCroatiaCyprusCzech RepublicDenmarkEarly-demographic dividendEast Asia & PacificEast Asia & Pacific (excluding high income)East Asia & Pacific (IDA & IBRD countries)EcuadorEgypt, Arab Rep.El SalvadorEstoniaEuro areaEurope & Central AsiaEurope & Central Asia (excluding high income)Europe & Central Asia (IDA & IBRD countries)European UnionFijiFinlandFranceGeorgiaGermanyGhanaGreeceGuyanaHigh incomeHong Kong SAR, ChinaHungaryIBRD onlyIcelandIDA & IBRD totalIDA blendIDA totalIndiaIndonesiaIran, Islamic Rep.IrelandIsraelItalyJamaicaJapanJordanKazakhstanKenyaKorea, Rep.KuwaitKyrgyz RepublicLate-demographic dividendLatin America & Caribbean Latin America & Caribbean (excluding high income)Latin America & the Caribbean (IDA & IBRD countries)LatviaLebanonLithuaniaLow & middle incomeLower middle incomeLuxembourgMacedonia, FYRMalawiMalaysiaMaltaMauritiusMexicoMiddle East & North AfricaMiddle East & North Africa (excluding high income)Middle East & North Africa (IDA & IBRD countries)Middle incomeMoldovaMongoliaMontenegroMoroccoNamibiaNetherlandsNew ZealandNigeriaNorth AmericaNorwayOECD membersOmanOther small statesPakistanPanamaPapua New GuineaParaguayPeruPhilippinesPolandPortugalPost-demographic dividendQatarRomaniaRussian FederationSaudi ArabiaSerbiaSeychellesSingaporeSlovak RepublicSloveniaSouth AfricaSouth AsiaSouth Asia (IDA & IBRD)SpainSri LankaSt. Kitts and NevisSub-Saharan Africa Sub-Saharan Africa (excluding high income)Sub-Saharan Africa (IDA & IBRD countries)SwazilandSwedenSwitzerlandTanzaniaThailandTrinidad and TobagoTunisiaTurkeyUgandaUkraineUnited Arab EmiratesUnited KingdomUnited StatesUpper middle incomeUruguayUzbekistanVenezuela, RBVietnamWest Bank and GazaWorldZambiaZimbabwe
línea de tiempo (timeline):
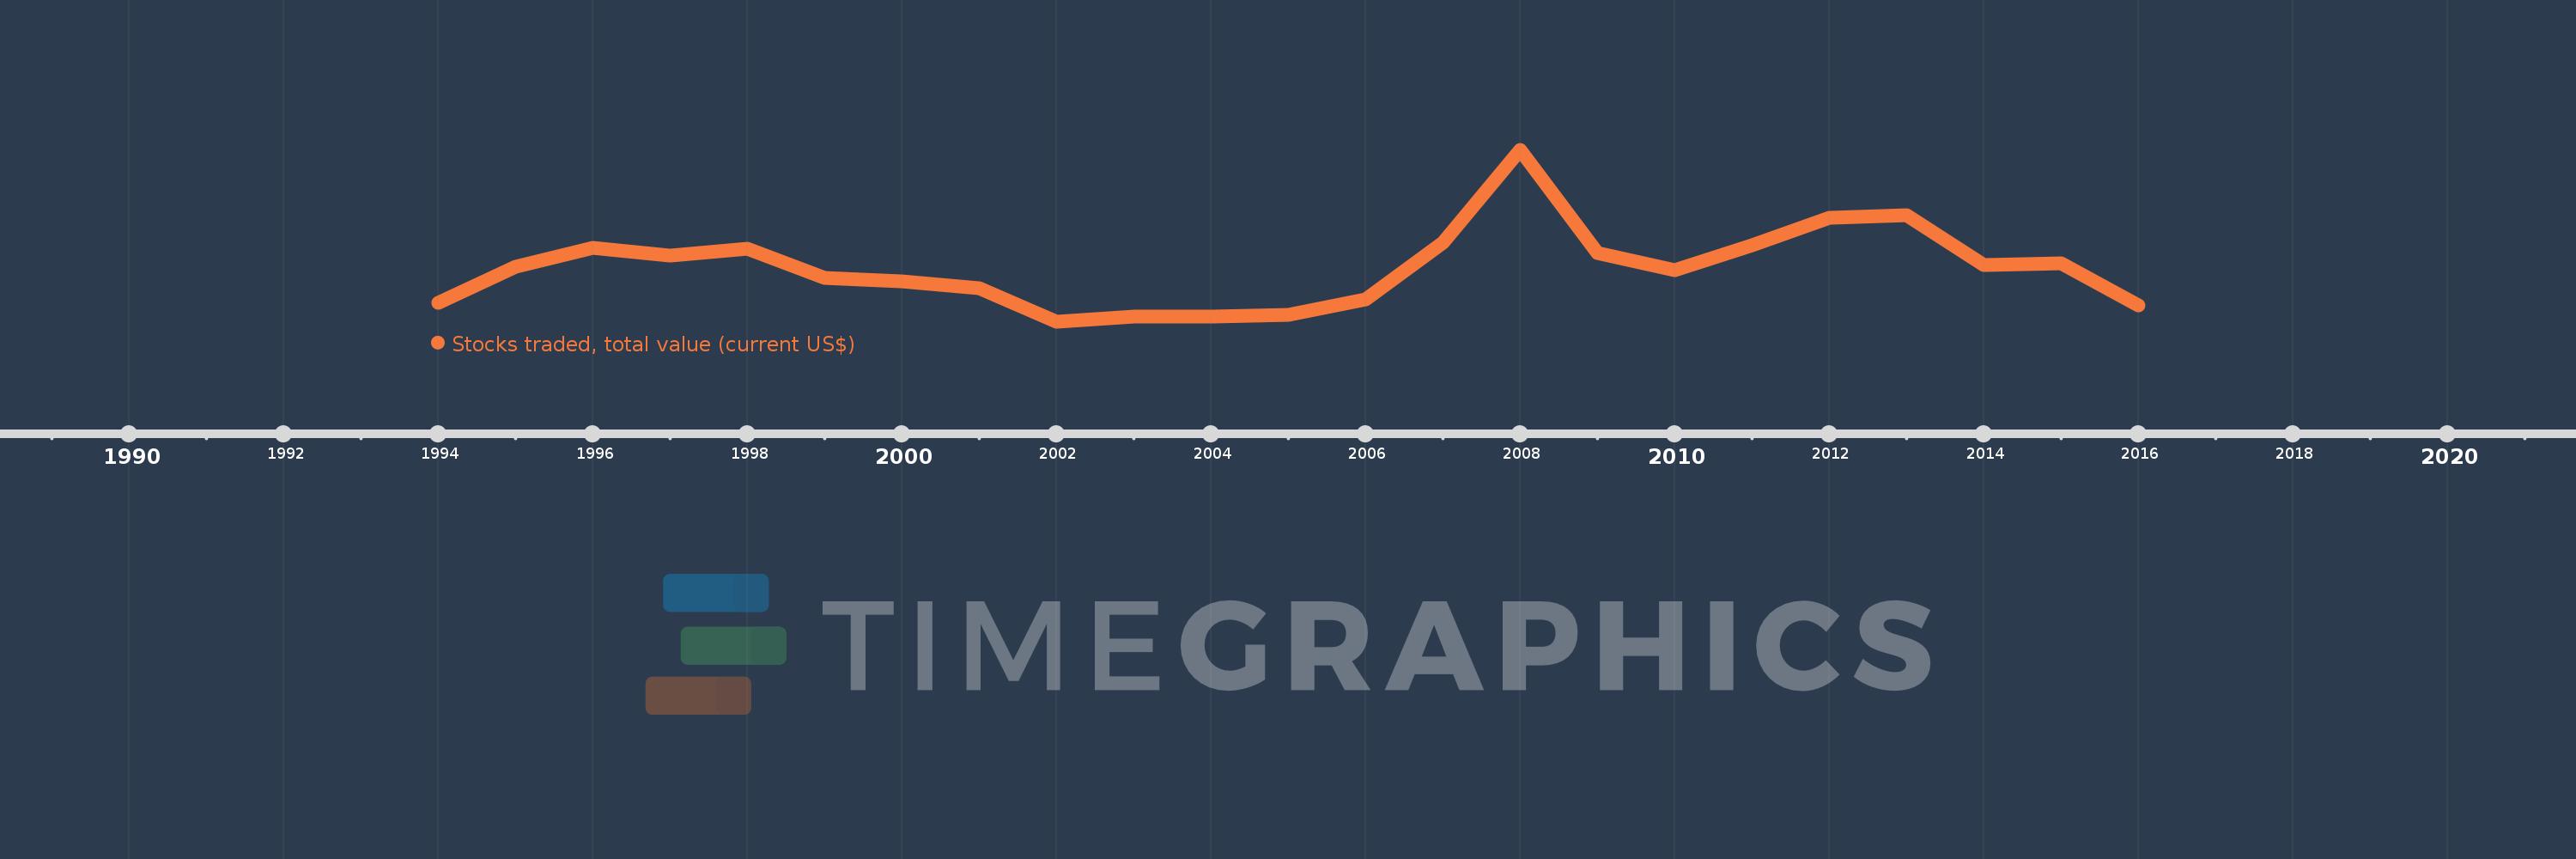
En esta escala de tiempo se presenta un gráfico de 1994 y 2016 de Peru. Los datos de 1993 están ausentes. El número de observaciones reales por fecha: 23.
Fuente (nombre):
Indicadores del desarrollo mundial
Fuente (organización):
World Federation of Exchanges database.
Categorías:
Financial Sector
Se ha actualizado:
23 abr 2017 año
Los indicadores de los cambios de valor en los últimos años
En promedio:
3.034 bn
Mínimo:
736.17 millones
1 ene 2002 año
Máximo:
8.061 bn
1 ene 2008 año
A la fecha de observación
Valor
Cambio absoluto
El cambio con respecto al valor anterior
1 ene 1994 año
1.548 bn
+1.548 bn
0.0%
1 ene 1995 año
3.091 bn
+1.544 bn
99.77%
1 ene 1996 año
3.885 bn
+793.4 millones
25.66%
1 ene 1997 año
3.554 bn
-330.7 millones
-8.51%
1 ene 1998 año
3.858 bn
+303.57 millones
8.54%
1 ene 1999 año
2.627 bn
-1.23 bn
-31.89%
1 ene 2000 año
2.455 bn
-172.37 millones
-6.56%
1 ene 2001 año
2.191 bn
-264.36 millones
-10.77%
1 ene 2002 año
736.17 millones
-1.454 bn
-66.39%
1 ene 2003 año
959.82 millones
+223.65 millones
30.38%
1 ene 2004 año
969.2 millones
+9.38 millones
0.98%
1 ene 2005 año
1.057 bn
+88.01 millones
9.08%
1 ene 2006 año
1.716 bn
+658.73 millones
62.31%
1 ene 2007 año
4.132 bn
+2.416 bn
140.82%
1 ene 2008 año
8.061 bn
+3.929 bn
95.07%
1 ene 2009 año
3.681 bn
-4.38 bn
-54.33%
1 ene 2010 año
2.959 bn
-722.37 millones
-19.62%
1 ene 2011 año
3.993 bn
+1.035 bn
34.97%
1 ene 2012 año
5.176 bn
+1.183 bn
29.62%
1 ene 2013 año
5.279 bn
+102.67 millones
1.98%
1 ene 2014 año
3.173 bn
-2.106 bn
-39.89%
1 ene 2015 año
3.228 bn
+54.59 millones
1.72%
1 ene 2016 año
1.451 bn
-1.777 bn
-55.04%
Ranking de los países por los datos estadísticos actuales

Comentarios:

Enviar
PremiumAbout & FeedbackAcuerdoPrivacidad
logo
© 2022 Selected Technologies LLC – Morgan Hill, California