33
/es/
AIzaSyAYiBZKx7MnpbEhh9jyipgxe19OcubqV5w
August 1, 2025
47750
Lower middle income
LMC
false
2
1
Stocks traded, total value (current US$)
2016,2015,2014,2013,2012,2011,2010,2009,2008,2007,2006,2005,2004,2003,2002,2001,2000,1999,1998
Download
Estadísticas Globales de la Biblioteca →Lower middle income →

Stocks traded, total value (current US$)

Estas estadísticas en otros países:

Arab WorldArgentinaArmeniaAustraliaAustriaBahrainBangladeshBarbadosBelgiumBermudaBoliviaBotswanaBrazilBulgariaCanadaCayman IslandsCentral Europe and the BalticsChannel IslandsChileChinaColombiaCosta RicaCote d'IvoireCroatiaCyprusCzech RepublicDenmarkEarly-demographic dividendEast Asia & PacificEast Asia & Pacific (excluding high income)East Asia & Pacific (IDA & IBRD countries)EcuadorEgypt, Arab Rep.El SalvadorEstoniaEuro areaEurope & Central AsiaEurope & Central Asia (excluding high income)Europe & Central Asia (IDA & IBRD countries)European UnionFijiFinlandFranceGeorgiaGermanyGhanaGreeceGuyanaHigh incomeHong Kong SAR, ChinaHungaryIBRD onlyIcelandIDA & IBRD totalIDA blendIDA totalIndiaIndonesiaIran, Islamic Rep.IrelandIsraelItalyJamaicaJapanJordanKazakhstanKenyaKorea, Rep.KuwaitKyrgyz RepublicLate-demographic dividendLatin America & Caribbean Latin America & Caribbean (excluding high income)Latin America & the Caribbean (IDA & IBRD countries)LatviaLebanonLithuaniaLow & middle incomeLower middle incomeLuxembourgMacedonia, FYRMalawiMalaysiaMaltaMauritiusMexicoMiddle East & North AfricaMiddle East & North Africa (excluding high income)Middle East & North Africa (IDA & IBRD countries)Middle incomeMoldovaMongoliaMontenegroMoroccoNamibiaNetherlandsNew ZealandNigeriaNorth AmericaNorwayOECD membersOmanOther small statesPakistanPanamaPapua New GuineaParaguayPeruPhilippinesPolandPortugalPost-demographic dividendQatarRomaniaRussian FederationSaudi ArabiaSerbiaSeychellesSingaporeSlovak RepublicSloveniaSouth AfricaSouth AsiaSouth Asia (IDA & IBRD)SpainSri LankaSt. Kitts and NevisSub-Saharan Africa Sub-Saharan Africa (excluding high income)Sub-Saharan Africa (IDA & IBRD countries)SwazilandSwedenSwitzerlandTanzaniaThailandTrinidad and TobagoTunisiaTurkeyUgandaUkraineUnited Arab EmiratesUnited KingdomUnited StatesUpper middle incomeUruguayUzbekistanVenezuela, RBVietnamWest Bank and GazaWorldZambiaZimbabwe

línea de tiempo (timeline):

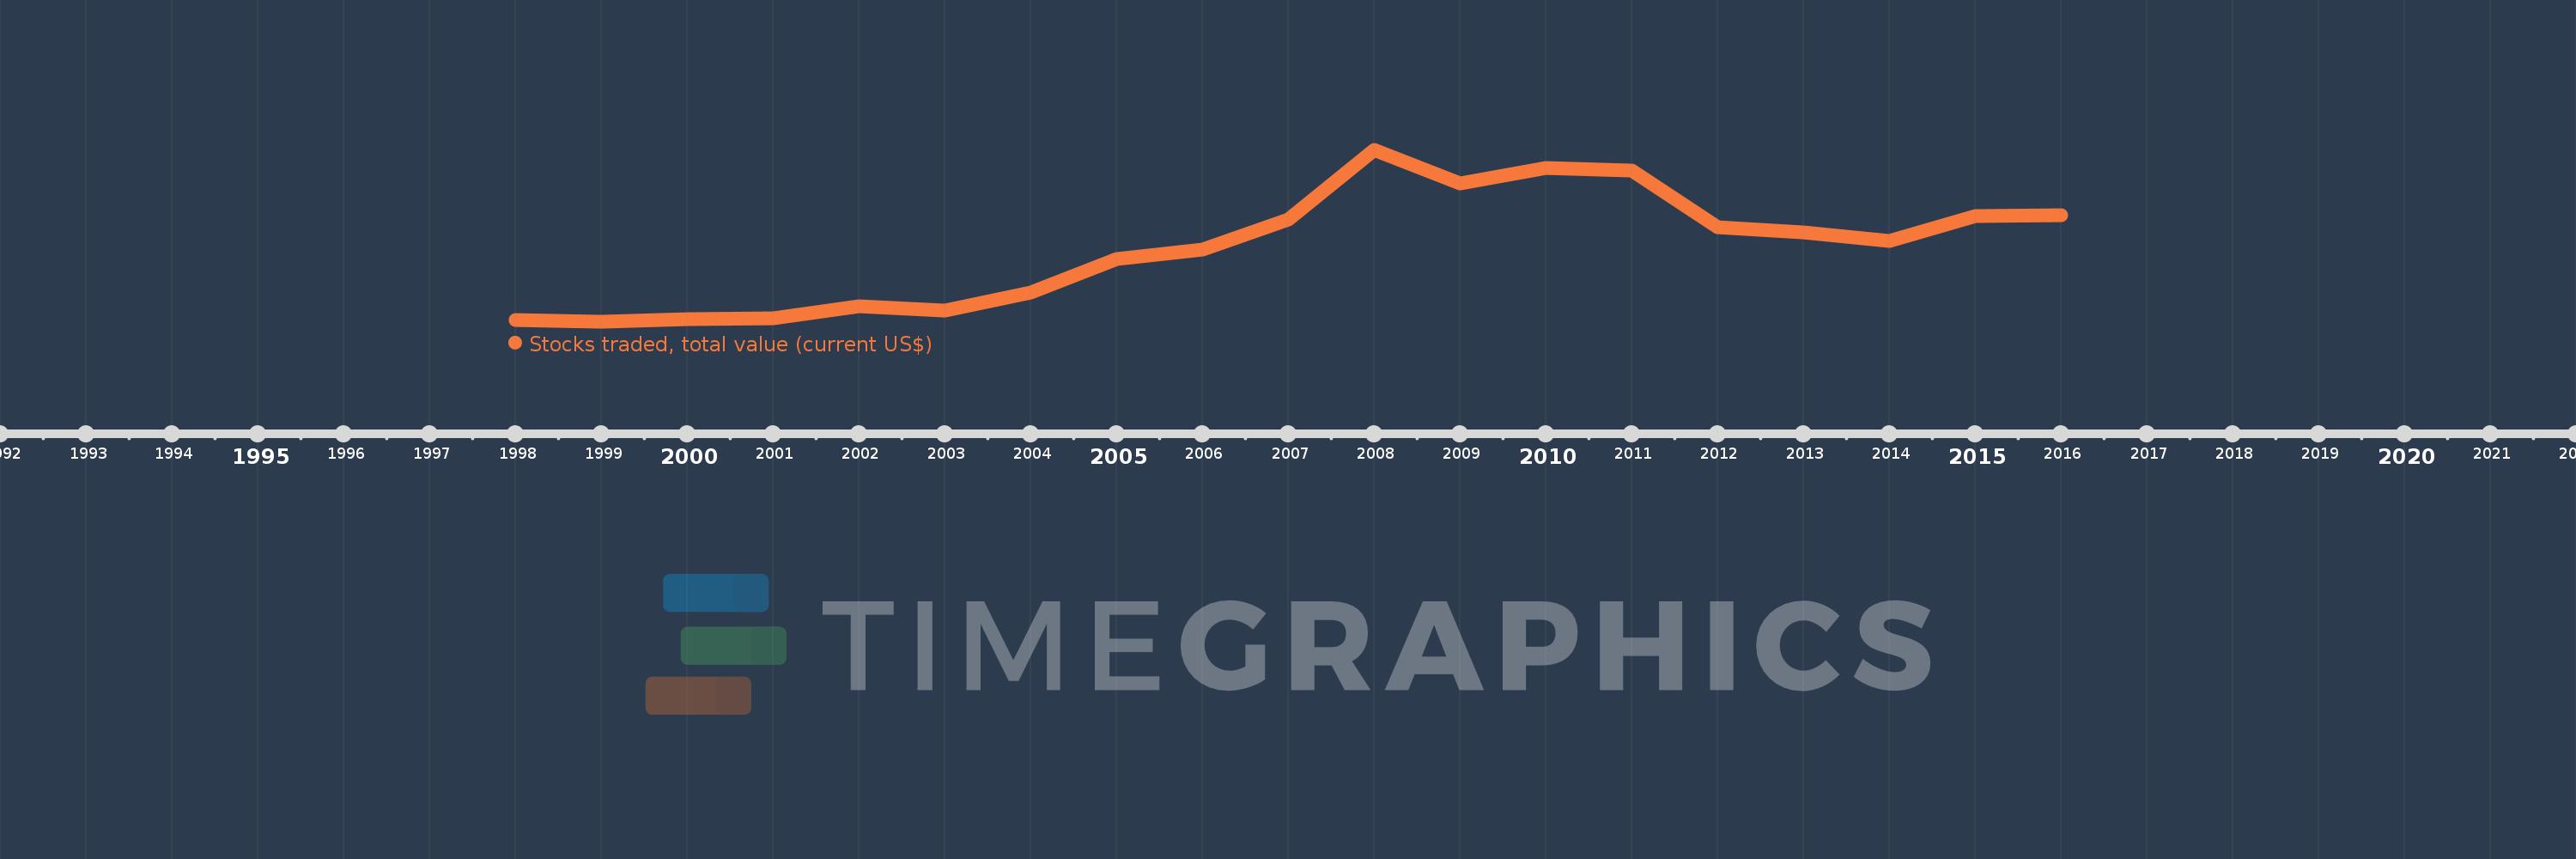
En esta escala de tiempo se presenta un gráfico de 1998 y 2016 de Lower middle income. Los datos de 1997 están ausentes. El número de observaciones reales por fecha: 19.

Fuente (nombre):

Indicadores del desarrollo mundial

Fuente (organización):

World Federation of Exchanges database.

Categorías:

Financial Sector

Se ha actualizado:

23 abr 2017 año

Los indicadores de los cambios de valor en los últimos años

En promedio:
655.977 bn
Mínimo:
46.886 bn
1 ene 1999 año
Máximo:
1.469 billones
1 ene 2008 año
A la fecha de observación
Valor
Cambio absoluto
El cambio con respecto al valor anterior
1 ene 1998 año
65.518 bn
+65.518 bn
0.0%
1 ene 1999 año
46.886 bn
-18.632 bn
-28.44%
1 ene 2000 año
71.407 bn
+24.521 bn
52.3%
1 ene 2001 año
77.84 bn
+6.433 bn
9.01%
1 ene 2002 año
179.478 bn
+101.638 bn
130.57%
1 ene 2003 año
144.541 bn
-34.937 bn
-19.47%
1 ene 2004 año
290.94 bn
+146.399 bn
101.29%
1 ene 2005 año
565.773 bn
+274.833 bn
94.46%
1 ene 2006 año
649.345 bn
+83.572 bn
14.77%
1 ene 2007 año
891.486 bn
+242.142 bn
37.29%
1 ene 2008 año
1.469 billones
+577.122 bn
64.74%
1 ene 2009 año
1.194 billones
-274.12 bn
-18.67%
1 ene 2010 año
1.323 billones
+128.177 bn
10.73%
1 ene 2011 año
1.303 billones
-19.5 bn
-1.47%
1 ene 2012 año
830.436 bn
-472.73 bn
-36.28%
1 ene 2013 año
786.95 bn
-43.486 bn
-5.24%
1 ene 2014 año
720.562 bn
-66.388 bn
-8.44%
1 ene 2015 año
924.956 bn
+204.394 bn
28.37%
1 ene 2016 año
928.525 bn
+3.569 bn
0.39%

Ranking de los países por los datos estadísticos actuales