29
/es/
es
AIzaSyAYiBZKx7MnpbEhh9jyipgxe19OcubqV5w
April 1, 2024
172230
Kuwait
KWT
true
2
1
Stocks traded, total value (current US$)
2014,2013,2012,2007,2006,2005,2004,2003,2002,1999,1998,1997,1996,1995,1994
Download
Estadísticas Globales de la Biblioteca →Kuwait →

Stocks traded, total value (current US$)

Estas estadísticas en otros países:
Arab WorldArgentinaArmeniaAustraliaAustriaBahrainBangladeshBarbadosBelgiumBermudaBoliviaBotswanaBrazilBulgariaCanadaCayman IslandsCentral Europe and the BalticsChannel IslandsChileChinaColombiaCosta RicaCote d'IvoireCroatiaCyprusCzech RepublicDenmarkEarly-demographic dividendEast Asia & PacificEast Asia & Pacific (excluding high income)East Asia & Pacific (IDA & IBRD countries)EcuadorEgypt, Arab Rep.El SalvadorEstoniaEuro areaEurope & Central AsiaEurope & Central Asia (excluding high income)Europe & Central Asia (IDA & IBRD countries)European UnionFijiFinlandFranceGeorgiaGermanyGhanaGreeceGuyanaHigh incomeHong Kong SAR, ChinaHungaryIBRD onlyIcelandIDA & IBRD totalIDA blendIDA totalIndiaIndonesiaIran, Islamic Rep.IrelandIsraelItalyJamaicaJapanJordanKazakhstanKenyaKorea, Rep.KuwaitKyrgyz RepublicLate-demographic dividendLatin America & Caribbean Latin America & Caribbean (excluding high income)Latin America & the Caribbean (IDA & IBRD countries)LatviaLebanonLithuaniaLow & middle incomeLower middle incomeLuxembourgMacedonia, FYRMalawiMalaysiaMaltaMauritiusMexicoMiddle East & North AfricaMiddle East & North Africa (excluding high income)Middle East & North Africa (IDA & IBRD countries)Middle incomeMoldovaMongoliaMontenegroMoroccoNamibiaNetherlandsNew ZealandNigeriaNorth AmericaNorwayOECD membersOmanOther small statesPakistanPanamaPapua New GuineaParaguayPeruPhilippinesPolandPortugalPost-demographic dividendQatarRomaniaRussian FederationSaudi ArabiaSerbiaSeychellesSingaporeSlovak RepublicSloveniaSouth AfricaSouth AsiaSouth Asia (IDA & IBRD)SpainSri LankaSt. Kitts and NevisSub-Saharan Africa Sub-Saharan Africa (excluding high income)Sub-Saharan Africa (IDA & IBRD countries)SwazilandSwedenSwitzerlandTanzaniaThailandTrinidad and TobagoTunisiaTurkeyUgandaUkraineUnited Arab EmiratesUnited KingdomUnited StatesUpper middle incomeUruguayUzbekistanVenezuela, RBVietnamWest Bank and GazaWorldZambiaZimbabwe
línea de tiempo (timeline):
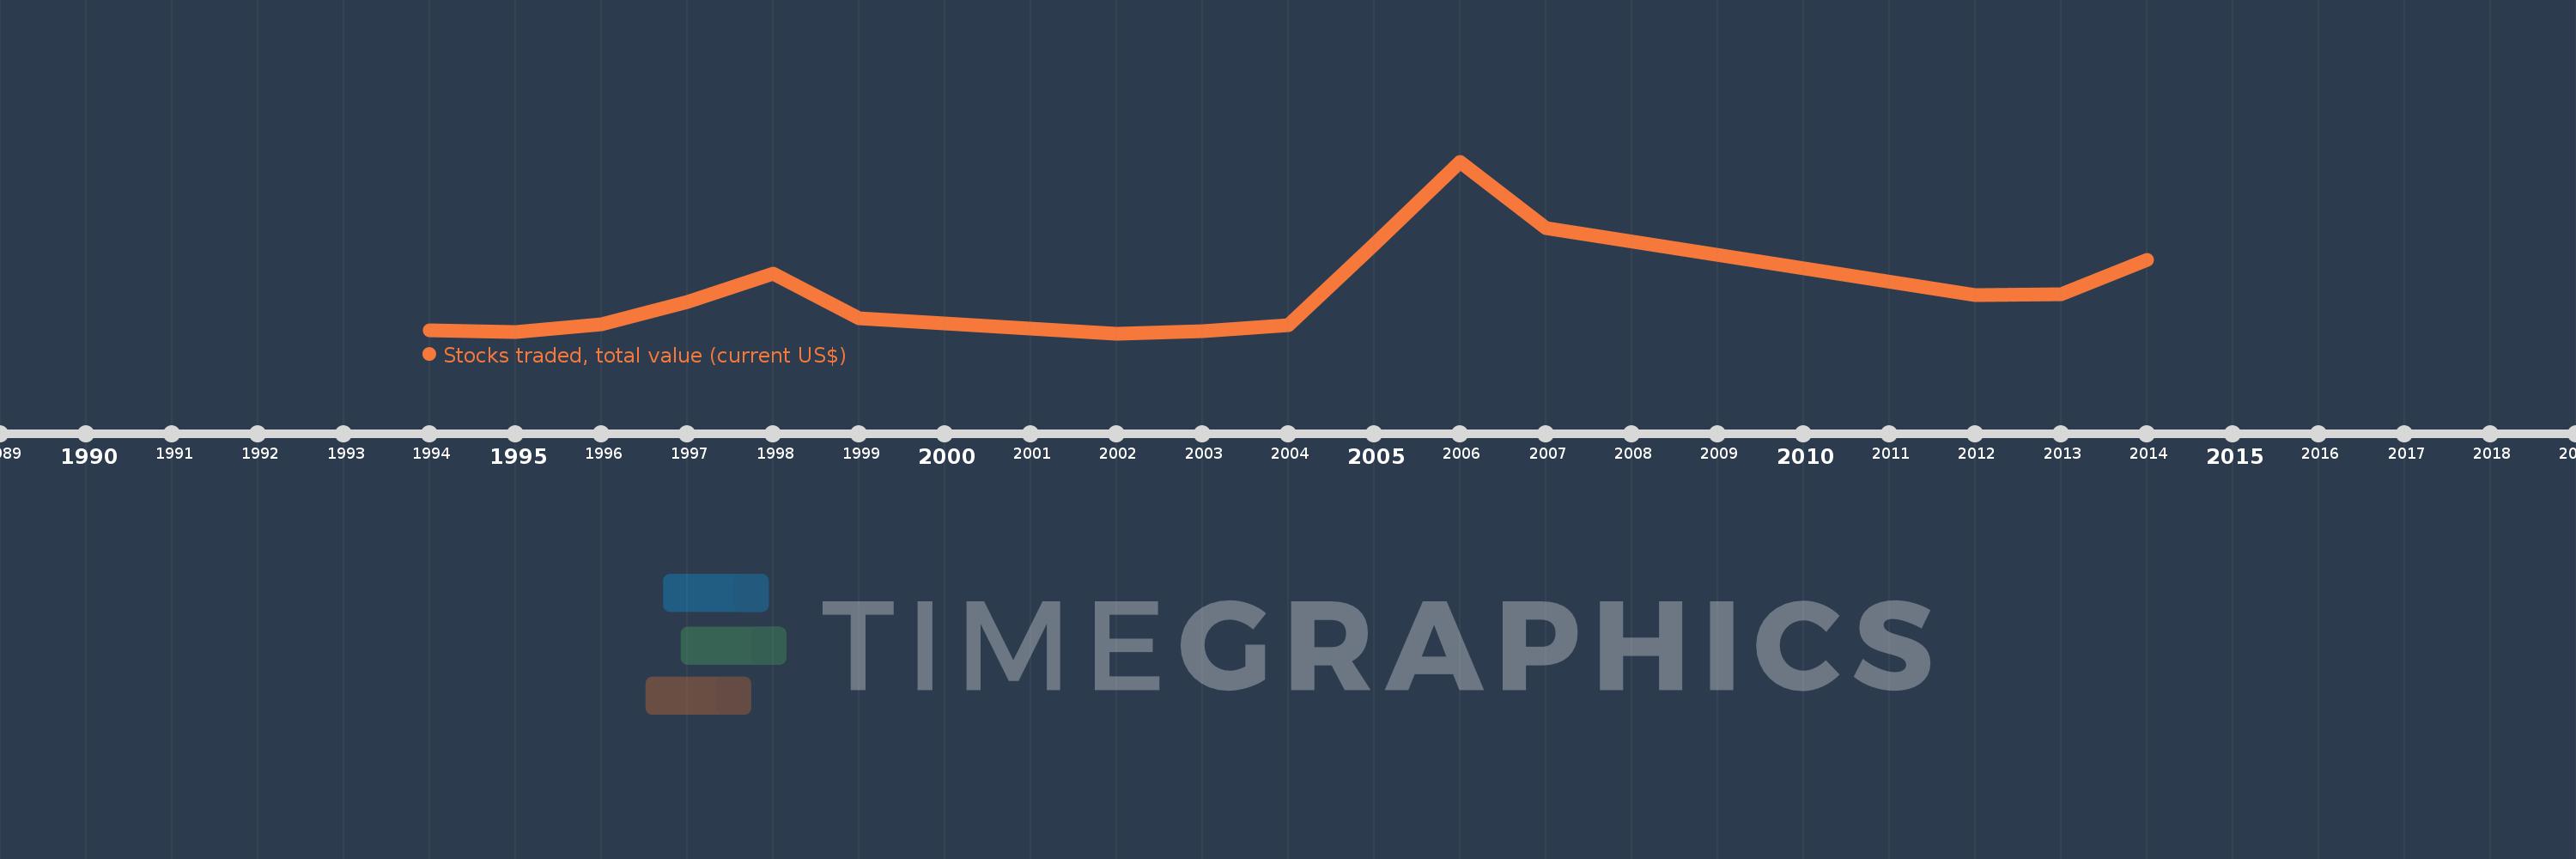
En esta escala de tiempo se presenta un gráfico de 1994 y 2014 de Kuwait. Los datos de 1993 están ausentes. El número de observaciones reales por fecha: 15.
Fuente (nombre):
Indicadores del desarrollo mundial
Fuente (organización):
World Federation of Exchanges database.
Categorías:
Financial Sector
Se ha actualizado:
23 abr 2017 año
Los indicadores de los cambios de valor en los últimos años
En promedio:
24.084 bn
Mínimo:
1.165 bn
1 ene 2002 año
Máximo:
92.368 bn
1 ene 2006 año
A la fecha de observación
Valor
Cambio absoluto
El cambio con respecto al valor anterior
1 ene 1994 año
2.588 bn
+2.588 bn
0.0%
1 ene 1995 año
1.926 bn
-662.5 millones
-25.6%
1 ene 1996 año
6.173 bn
+4.248 bn
220.58%
1 ene 1997 año
17.79 bn
+11.617 bn
188.17%
1 ene 1998 año
32.986 bn
+15.196 bn
85.42%
1 ene 1999 año
9.271 bn
-23.715 bn
-71.9%
1 ene 2002 año
1.165 bn
-8.105 bn
-87.43%
1 ene 2003 año
2.23 bn
+1.065 bn
91.34%
1 ene 2004 año
5.61 bn
+3.38 bn
151.57%
1 ene 2005 año
48.454 bn
+42.844 bn
763.71%
1 ene 2006 año
92.368 bn
+43.914 bn
90.63%
1 ene 2007 año
57.196 bn
-35.172 bn
-38.08%
1 ene 2012 año
21.4 bn
-35.796 bn
-62.58%
1 ene 2013 año
21.764 bn
+364.2 millones
1.7%
1 ene 2014 año
40.331 bn
+18.567 bn
85.31%
Ranking de los países por los datos estadísticos actuales

Comentarios:

Enviar
PremiumAbout & FeedbackAcuerdoPrivacidad
logo
© 2022 Selected Technologies LLC – Morgan Hill, California