29
/es/
es
AIzaSyAYiBZKx7MnpbEhh9jyipgxe19OcubqV5w
April 1, 2024
215825
Oman
OMN
true
2
1
Stocks traded, total value (current US$)
2016,2015,2014,2013,2012,2011,2010,2009,2008,2007,2006,2005,2002,2001,2000,1999,1998,1997,1996,1995,1994
Download
Estadísticas Globales de la Biblioteca →Oman →

Stocks traded, total value (current US$)

Estas estadísticas en otros países:
Arab WorldArgentinaArmeniaAustraliaAustriaBahrainBangladeshBarbadosBelgiumBermudaBoliviaBotswanaBrazilBulgariaCanadaCayman IslandsCentral Europe and the BalticsChannel IslandsChileChinaColombiaCosta RicaCote d'IvoireCroatiaCyprusCzech RepublicDenmarkEarly-demographic dividendEast Asia & PacificEast Asia & Pacific (excluding high income)East Asia & Pacific (IDA & IBRD countries)EcuadorEgypt, Arab Rep.El SalvadorEstoniaEuro areaEurope & Central AsiaEurope & Central Asia (excluding high income)Europe & Central Asia (IDA & IBRD countries)European UnionFijiFinlandFranceGeorgiaGermanyGhanaGreeceGuyanaHigh incomeHong Kong SAR, ChinaHungaryIBRD onlyIcelandIDA & IBRD totalIDA blendIDA totalIndiaIndonesiaIran, Islamic Rep.IrelandIsraelItalyJamaicaJapanJordanKazakhstanKenyaKorea, Rep.KuwaitKyrgyz RepublicLate-demographic dividendLatin America & Caribbean Latin America & Caribbean (excluding high income)Latin America & the Caribbean (IDA & IBRD countries)LatviaLebanonLithuaniaLow & middle incomeLower middle incomeLuxembourgMacedonia, FYRMalawiMalaysiaMaltaMauritiusMexicoMiddle East & North AfricaMiddle East & North Africa (excluding high income)Middle East & North Africa (IDA & IBRD countries)Middle incomeMoldovaMongoliaMontenegroMoroccoNamibiaNetherlandsNew ZealandNigeriaNorth AmericaNorwayOECD membersOmanOther small statesPakistanPanamaPapua New GuineaParaguayPeruPhilippinesPolandPortugalPost-demographic dividendQatarRomaniaRussian FederationSaudi ArabiaSerbiaSeychellesSingaporeSlovak RepublicSloveniaSouth AfricaSouth AsiaSouth Asia (IDA & IBRD)SpainSri LankaSt. Kitts and NevisSub-Saharan Africa Sub-Saharan Africa (excluding high income)Sub-Saharan Africa (IDA & IBRD countries)SwazilandSwedenSwitzerlandTanzaniaThailandTrinidad and TobagoTunisiaTurkeyUgandaUkraineUnited Arab EmiratesUnited KingdomUnited StatesUpper middle incomeUruguayUzbekistanVenezuela, RBVietnamWest Bank and GazaWorldZambiaZimbabwe
línea de tiempo (timeline):
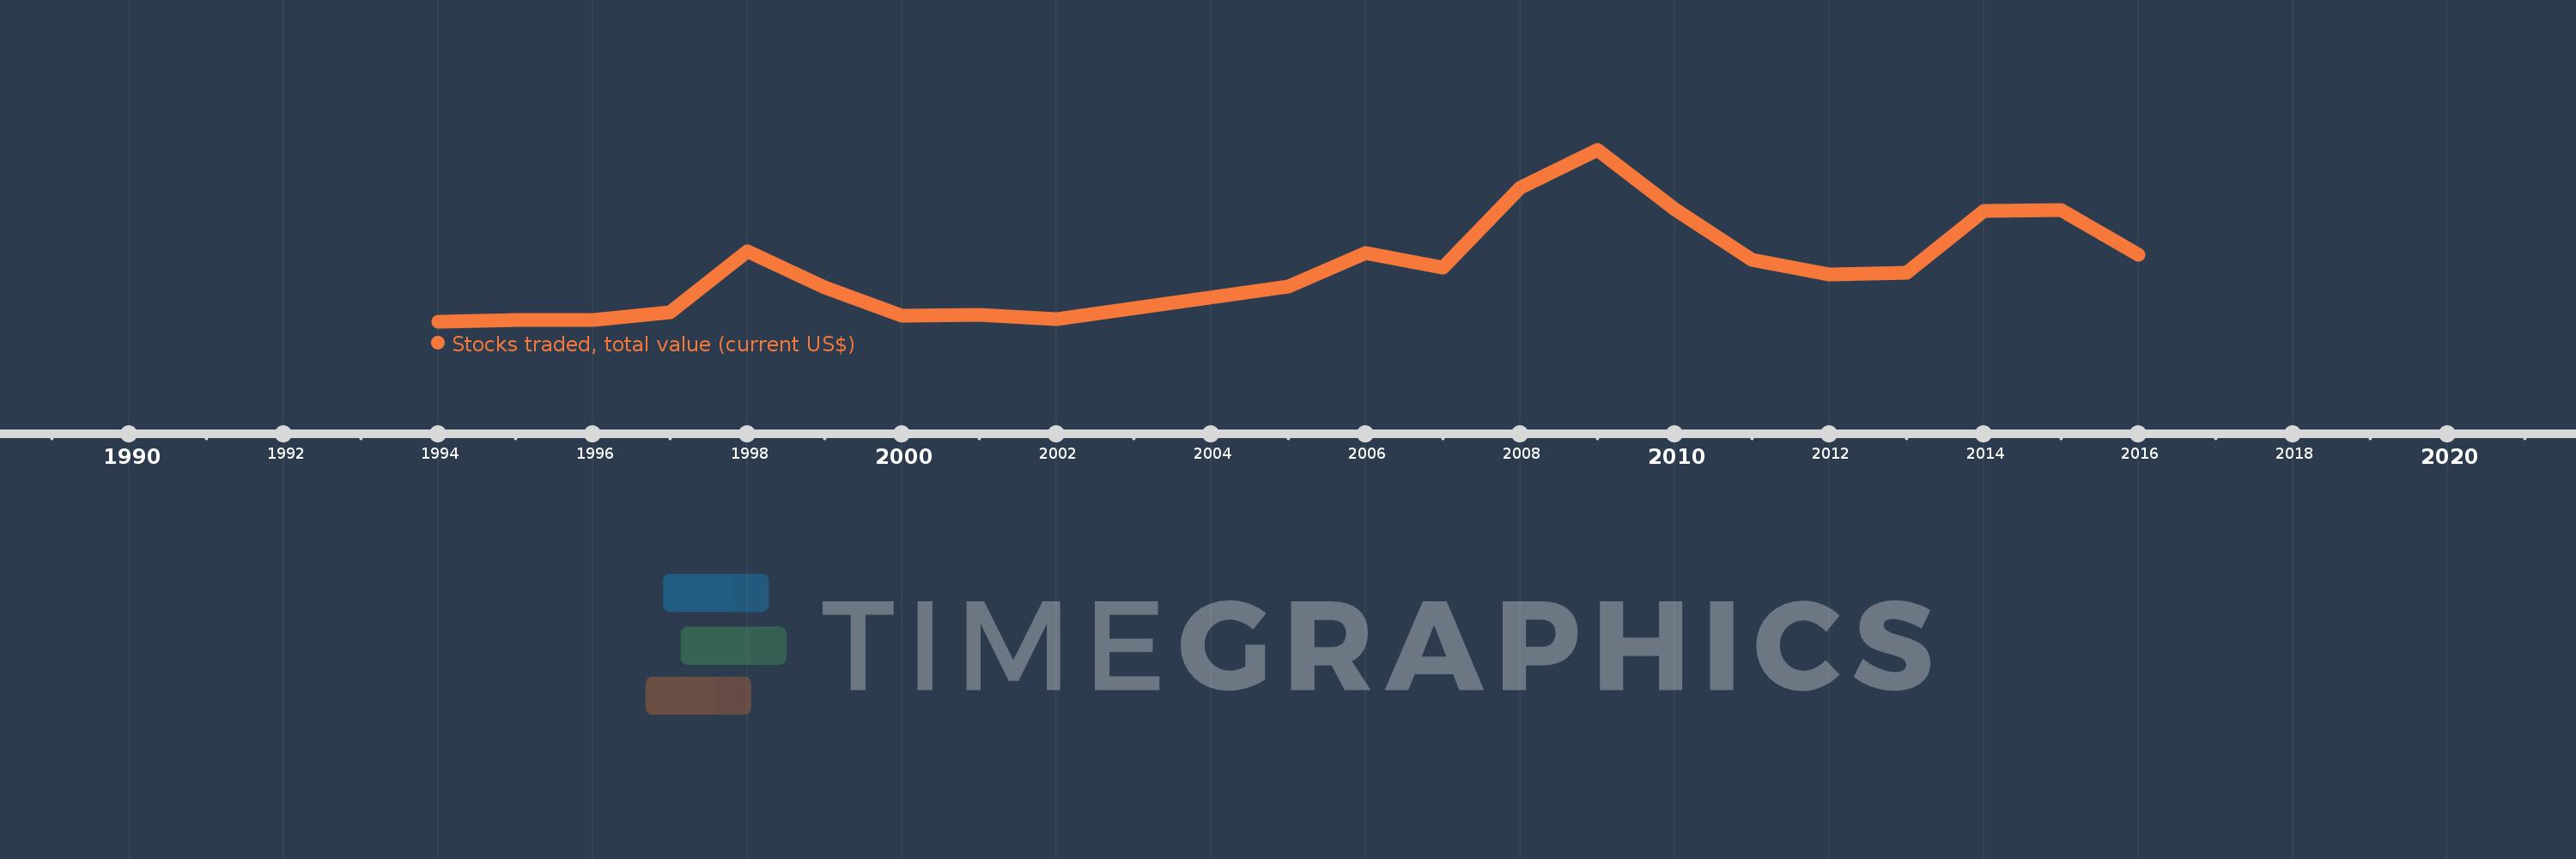
En esta escala de tiempo se presenta un gráfico de 1994 y 2016 de Oman. Los datos de 1993 están ausentes. El número de observaciones reales por fecha: 21.
Fuente (nombre):
Indicadores del desarrollo mundial
Fuente (organización):
World Federation of Exchanges database.
Categorías:
Financial Sector
Se ha actualizado:
23 abr 2017 año
Los indicadores de los cambios de valor en los últimos años
En promedio:
2.961 bn
Mínimo:
187.9 millones
1 ene 1994 año
Máximo:
8.8 bn
1 ene 2009 año
A la fecha de observación
Valor
Cambio absoluto
El cambio con respecto al valor anterior
1 ene 1994 año
187.9 millones
+187.9 millones
0.0%
1 ene 1995 año
304.3 millones
+116.4 millones
61.95%
1 ene 1996 año
269.78 millones
-34.52 millones
-11.34%
1 ene 1997 año
657.91 millones
+388.13 millones
143.87%
1 ene 1998 año
3.728 bn
+3.07 bn
466.57%
1 ene 1999 año
1.942 bn
-1.785 bn
-47.9%
1 ene 2000 año
485.85 millones
-1.456 bn
-74.98%
1 ene 2001 año
548.6 millones
+62.75 millones
12.92%
1 ene 2002 año
348.0 millones
-200.6 millones
-36.57%
1 ene 2005 año
1.971 bn
+1.623 bn
466.5%
1 ene 2006 año
3.654 bn
+1.683 bn
85.36%
1 ene 2007 año
2.917 bn
-737.4 millones
-20.18%
1 ene 2008 año
6.909 bn
+3.993 bn
136.88%
1 ene 2009 año
8.8 bn
+1.89 bn
27.36%
1 ene 2010 año
5.834 bn
-2.966 bn
-33.7%
1 ene 2011 año
3.309 bn
-2.525 bn
-43.27%
1 ene 2012 año
2.549 bn
-760.49 millones
-22.98%
1 ene 2013 año
2.663 bn
+113.75 millones
4.46%
1 ene 2014 año
5.736 bn
+3.073 bn
115.41%
1 ene 2015 año
5.805 bn
+69.32 millones
1.21%
1 ene 2016 año
3.56 bn
-2.245 bn
-38.68%
Ranking de los países por los datos estadísticos actuales

Comentarios:

Enviar
PremiumAbout & FeedbackAcuerdoPrivacidad
logo
© 2022 Selected Technologies LLC – Morgan Hill, California