29
/es/
es
AIzaSyAYiBZKx7MnpbEhh9jyipgxe19OcubqV5w
April 1, 2024
106669
China
CHN
true
2
1
Stocks traded, total value (current US$)
2016,2015,2014,2013,2012,2011,2010,2009,2008,2007,2006,2005,2004,2003,2002,2001,2000,1999,1998,1997,1996,1995,1994
Download
Estadísticas Globales de la Biblioteca →China →

Stocks traded, total value (current US$)

Estas estadísticas en otros países:
Arab WorldArgentinaArmeniaAustraliaAustriaBahrainBangladeshBarbadosBelgiumBermudaBoliviaBotswanaBrazilBulgariaCanadaCayman IslandsCentral Europe and the BalticsChannel IslandsChileChinaColombiaCosta RicaCote d'IvoireCroatiaCyprusCzech RepublicDenmarkEarly-demographic dividendEast Asia & PacificEast Asia & Pacific (excluding high income)East Asia & Pacific (IDA & IBRD countries)EcuadorEgypt, Arab Rep.El SalvadorEstoniaEuro areaEurope & Central AsiaEurope & Central Asia (excluding high income)Europe & Central Asia (IDA & IBRD countries)European UnionFijiFinlandFranceGeorgiaGermanyGhanaGreeceGuyanaHigh incomeHong Kong SAR, ChinaHungaryIBRD onlyIcelandIDA & IBRD totalIDA blendIDA totalIndiaIndonesiaIran, Islamic Rep.IrelandIsraelItalyJamaicaJapanJordanKazakhstanKenyaKorea, Rep.KuwaitKyrgyz RepublicLate-demographic dividendLatin America & Caribbean Latin America & Caribbean (excluding high income)Latin America & the Caribbean (IDA & IBRD countries)LatviaLebanonLithuaniaLow & middle incomeLower middle incomeLuxembourgMacedonia, FYRMalawiMalaysiaMaltaMauritiusMexicoMiddle East & North AfricaMiddle East & North Africa (excluding high income)Middle East & North Africa (IDA & IBRD countries)Middle incomeMoldovaMongoliaMontenegroMoroccoNamibiaNetherlandsNew ZealandNigeriaNorth AmericaNorwayOECD membersOmanOther small statesPakistanPanamaPapua New GuineaParaguayPeruPhilippinesPolandPortugalPost-demographic dividendQatarRomaniaRussian FederationSaudi ArabiaSerbiaSeychellesSingaporeSlovak RepublicSloveniaSouth AfricaSouth AsiaSouth Asia (IDA & IBRD)SpainSri LankaSt. Kitts and NevisSub-Saharan Africa Sub-Saharan Africa (excluding high income)Sub-Saharan Africa (IDA & IBRD countries)SwazilandSwedenSwitzerlandTanzaniaThailandTrinidad and TobagoTunisiaTurkeyUgandaUkraineUnited Arab EmiratesUnited KingdomUnited StatesUpper middle incomeUruguayUzbekistanVenezuela, RBVietnamWest Bank and GazaWorldZambiaZimbabwe
línea de tiempo (timeline):
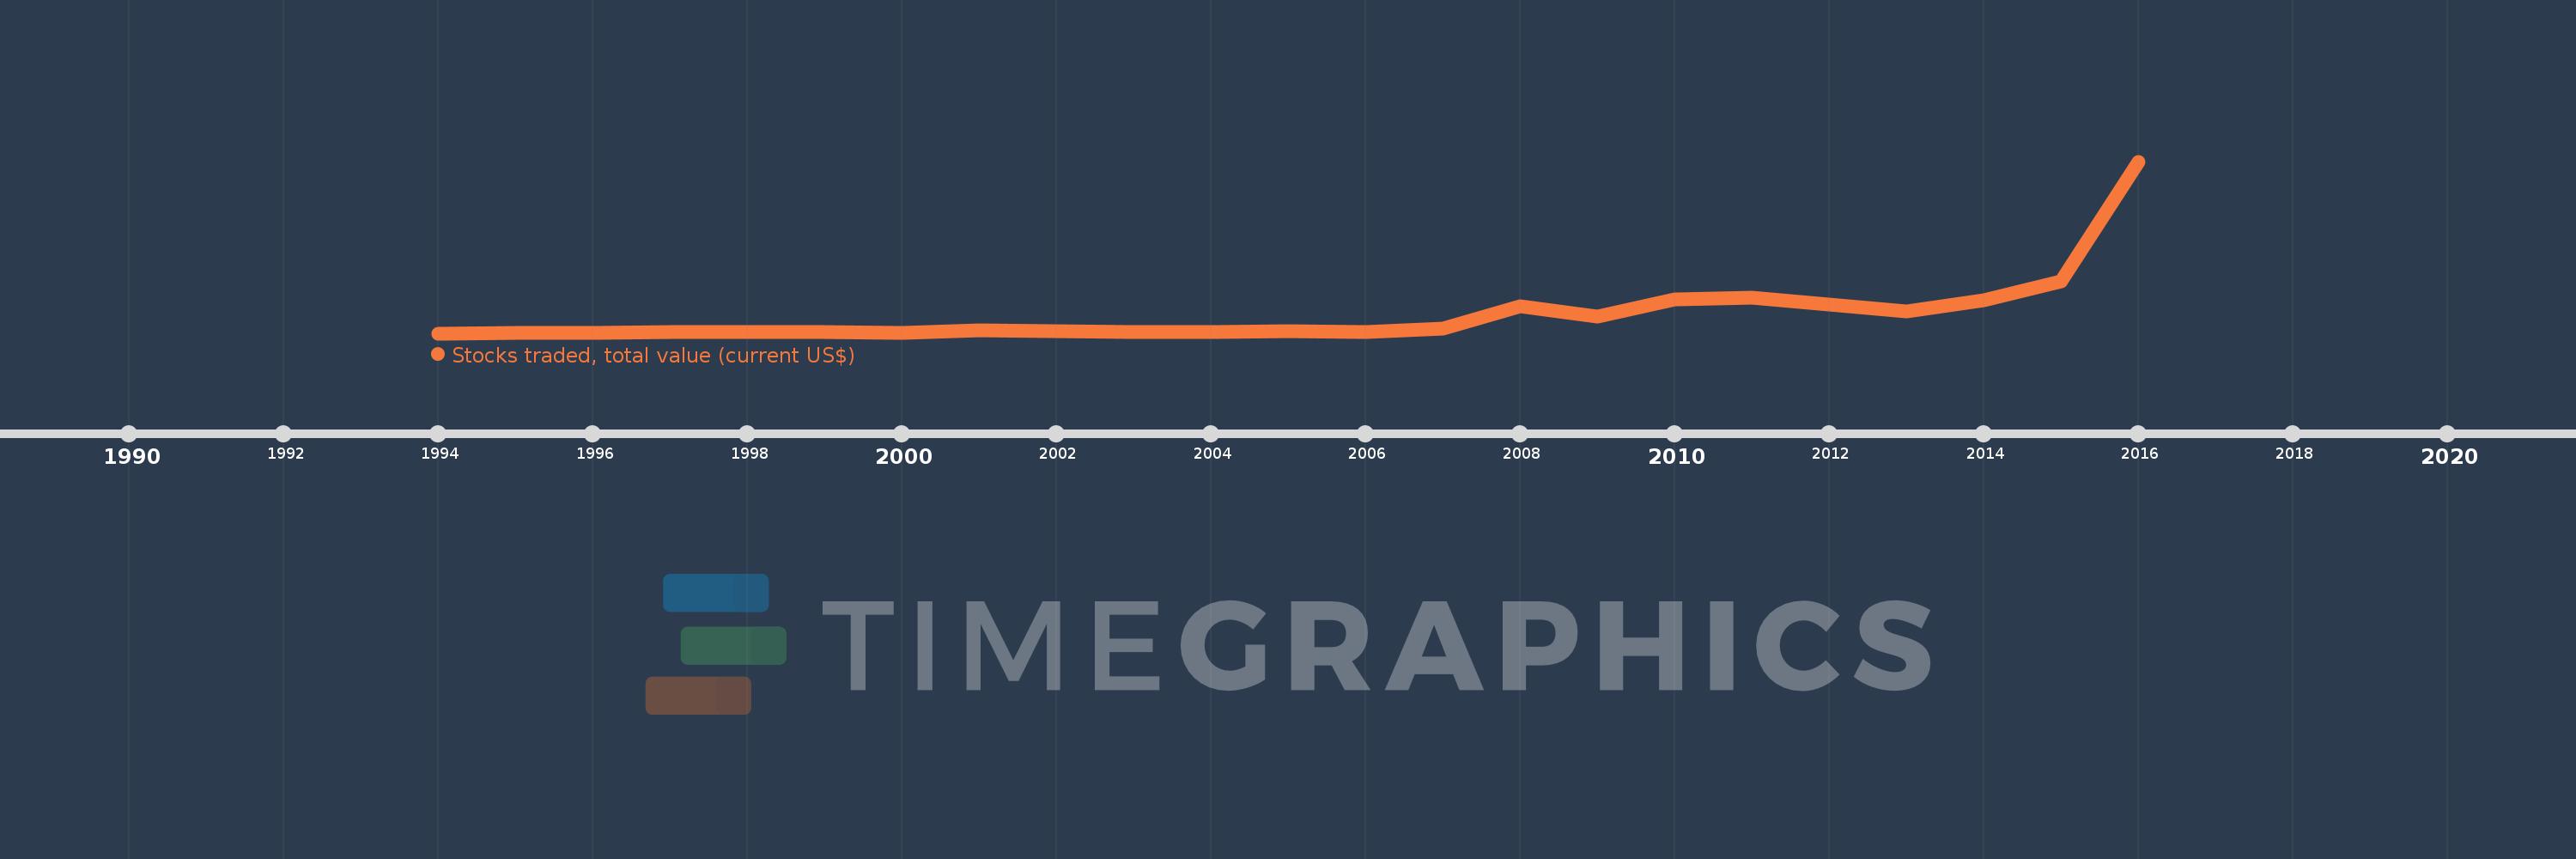
En esta escala de tiempo se presenta un gráfico de 1994 y 2016 de China. Los datos de 1993 están ausentes. El número de observaciones reales por fecha: 23.
Fuente (nombre):
Indicadores del desarrollo mundial
Fuente (organización):
World Federation of Exchanges database.
Categorías:
Financial Sector
Se ha actualizado:
23 abr 2017 año
Los indicadores de los cambios de valor en los últimos años
En promedio:
4.45 billones
Mínimo:
39.965 bn
1 ene 1994 año
Máximo:
39.326 billones
1 ene 2016 año
A la fecha de observación
Valor
Cambio absoluto
El cambio con respecto al valor anterior
1 ene 1994 año
39.965 bn
+39.965 bn
0.0%
1 ene 1995 año
68.173 bn
+28.207 bn
70.58%
1 ene 1996 año
77.529 bn
+9.356 bn
13.72%
1 ene 1997 año
307.739 bn
+230.21 bn
296.94%
1 ene 1998 año
371.055 bn
+63.316 bn
20.57%
1 ene 1999 año
284.39 bn
-86.665 bn
-23.36%
1 ene 2000 año
204.913 bn
-79.477 bn
-27.95%
1 ene 2001 año
752.583 bn
+547.67 bn
267.27%
1 ene 2002 año
462.779 bn
-289.804 bn
-38.51%
1 ene 2003 año
338.208 bn
-124.571 bn
-26.92%
1 ene 2004 año
388.002 bn
+49.794 bn
14.72%
1 ene 2005 año
511.496 bn
+123.494 bn
31.83%
1 ene 2006 año
392.367 bn
-119.129 bn
-23.29%
1 ene 2007 año
1.159 billones
+766.624 bn
195.38%
1 ene 2008 año
6.305 billones
+5.146 billones
444.05%
1 ene 2009 año
3.905 billones
-2.4 billones
-38.07%
1 ene 2010 año
7.831 billones
+3.926 billones
100.53%
1 ene 2011 año
8.258 billones
+426.966 bn
5.45%
1 ene 2012 año
6.674 billones
-1.584 billones
-19.18%
1 ene 2013 año
5.027 billones
-1.647 billones
-24.67%
1 ene 2014 año
7.696 billones
+2.669 billones
53.09%
1 ene 2015 año
11.959 billones
+4.263 billones
55.4%
1 ene 2016 año
39.326 billones
+27.367 billones
228.83%
Ranking de los países por los datos estadísticos actuales

Comentarios:

Enviar
PremiumAbout & FeedbackAcuerdoPrivacidad
logo
© 2022 Selected Technologies LLC – Morgan Hill, California