29
/es/
es
AIzaSyAYiBZKx7MnpbEhh9jyipgxe19OcubqV5w
April 1, 2024
51513
Middle income
MIC
false
2
1
Stocks traded, total value (current US$)
2016,2015,2014,2013,2012,2011,2010,2009,2008,2007,2006,2005,2004,2003,2002,2001,2000,1999,1998,1997,1996,1995,1994
Download
Estadísticas Globales de la Biblioteca →Middle income →

Stocks traded, total value (current US$)

Estas estadísticas en otros países:
Arab WorldArgentinaArmeniaAustraliaAustriaBahrainBangladeshBarbadosBelgiumBermudaBoliviaBotswanaBrazilBulgariaCanadaCayman IslandsCentral Europe and the BalticsChannel IslandsChileChinaColombiaCosta RicaCote d'IvoireCroatiaCyprusCzech RepublicDenmarkEarly-demographic dividendEast Asia & PacificEast Asia & Pacific (excluding high income)East Asia & Pacific (IDA & IBRD countries)EcuadorEgypt, Arab Rep.El SalvadorEstoniaEuro areaEurope & Central AsiaEurope & Central Asia (excluding high income)Europe & Central Asia (IDA & IBRD countries)European UnionFijiFinlandFranceGeorgiaGermanyGhanaGreeceGuyanaHigh incomeHong Kong SAR, ChinaHungaryIBRD onlyIcelandIDA & IBRD totalIDA blendIDA totalIndiaIndonesiaIran, Islamic Rep.IrelandIsraelItalyJamaicaJapanJordanKazakhstanKenyaKorea, Rep.KuwaitKyrgyz RepublicLate-demographic dividendLatin America & Caribbean Latin America & Caribbean (excluding high income)Latin America & the Caribbean (IDA & IBRD countries)LatviaLebanonLithuaniaLow & middle incomeLower middle incomeLuxembourgMacedonia, FYRMalawiMalaysiaMaltaMauritiusMexicoMiddle East & North AfricaMiddle East & North Africa (excluding high income)Middle East & North Africa (IDA & IBRD countries)Middle incomeMoldovaMongoliaMontenegroMoroccoNamibiaNetherlandsNew ZealandNigeriaNorth AmericaNorwayOECD membersOmanOther small statesPakistanPanamaPapua New GuineaParaguayPeruPhilippinesPolandPortugalPost-demographic dividendQatarRomaniaRussian FederationSaudi ArabiaSerbiaSeychellesSingaporeSlovak RepublicSloveniaSouth AfricaSouth AsiaSouth Asia (IDA & IBRD)SpainSri LankaSt. Kitts and NevisSub-Saharan Africa Sub-Saharan Africa (excluding high income)Sub-Saharan Africa (IDA & IBRD countries)SwazilandSwedenSwitzerlandTanzaniaThailandTrinidad and TobagoTunisiaTurkeyUgandaUkraineUnited Arab EmiratesUnited KingdomUnited StatesUpper middle incomeUruguayUzbekistanVenezuela, RBVietnamWest Bank and GazaWorldZambiaZimbabwe
línea de tiempo (timeline):
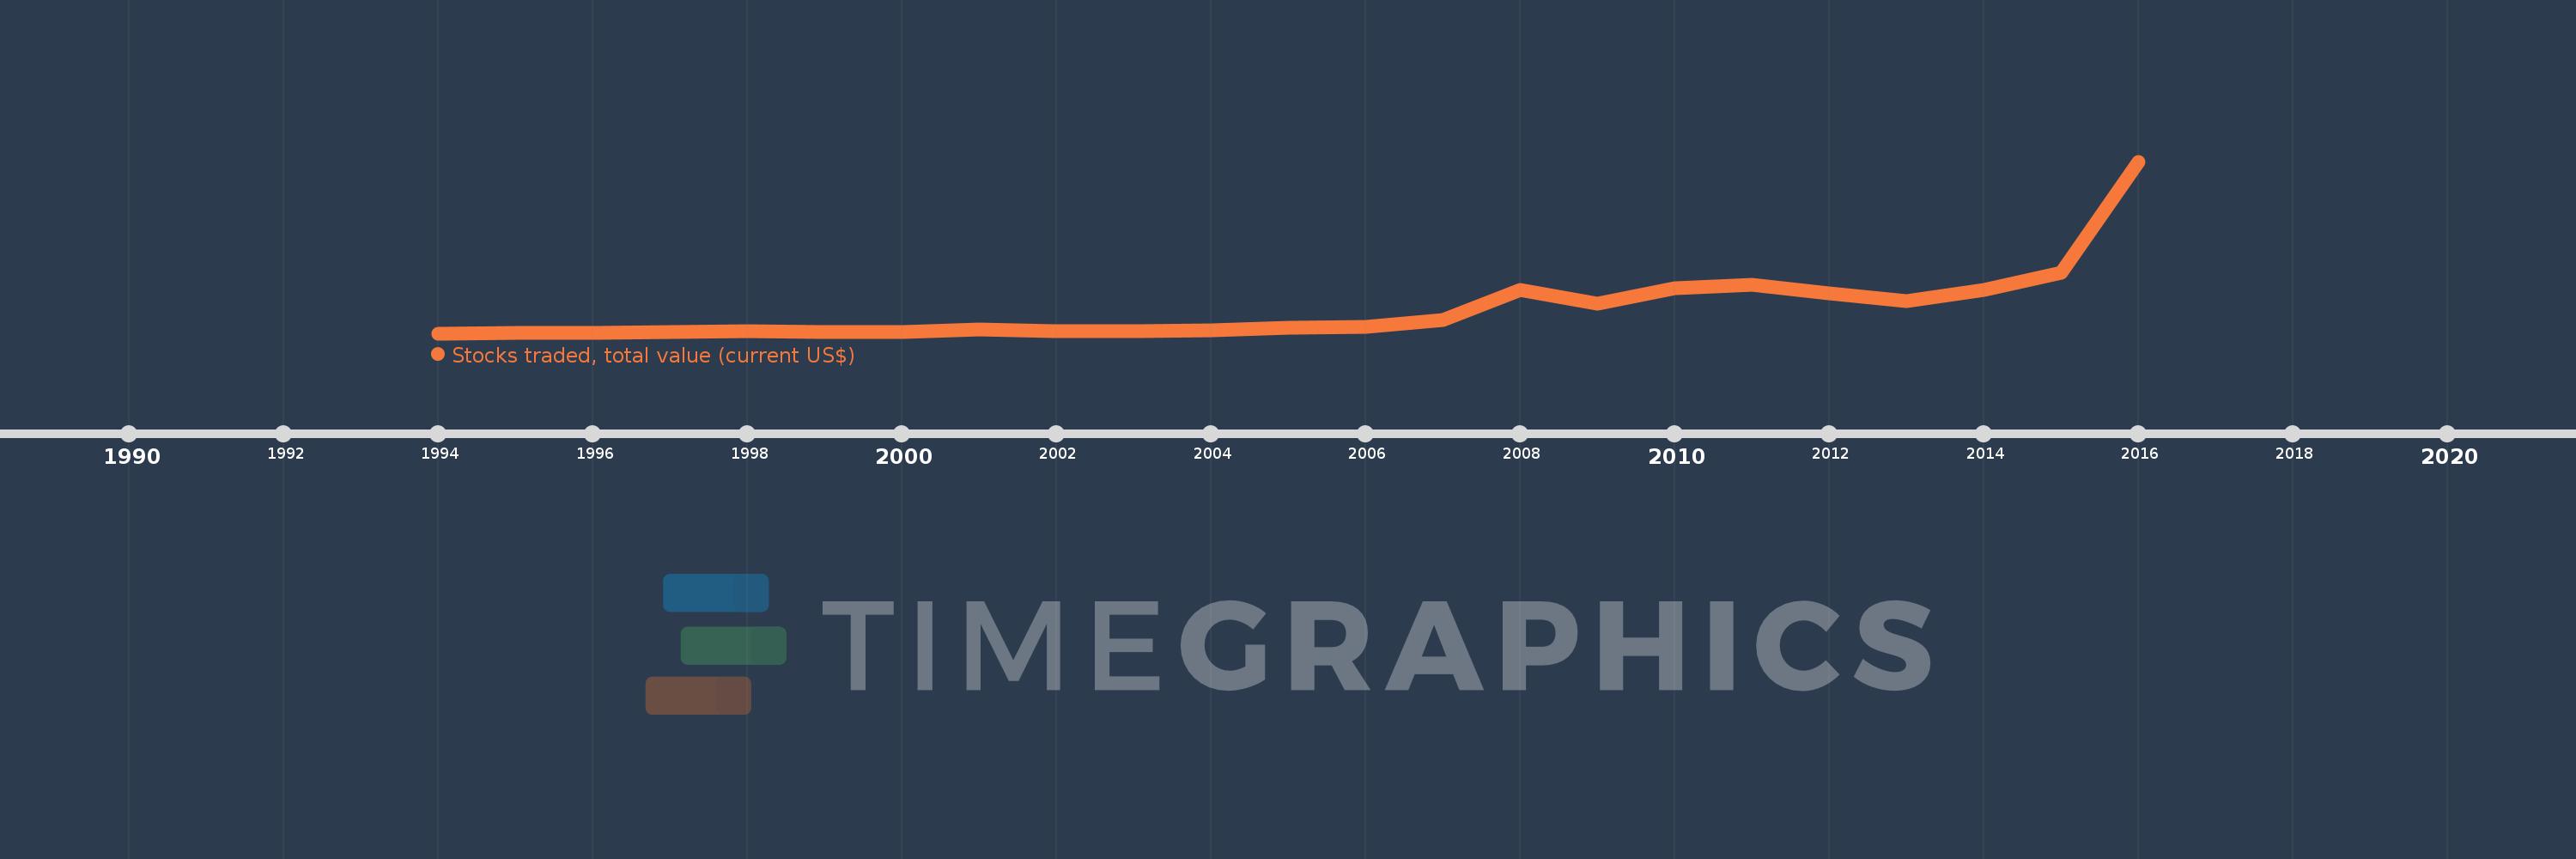
En esta escala de tiempo se presenta un gráfico de 1994 y 2016 de Middle income. Los datos de 1993 están ausentes. El número de observaciones reales por fecha: 23.
Fuente (nombre):
Indicadores del desarrollo mundial
Fuente (organización):
World Federation of Exchanges database.
Categorías:
Financial Sector
Se ha actualizado:
23 abr 2017 año
Los indicadores de los cambios de valor en los últimos años
En promedio:
6.226 billones
Mínimo:
335.28 bn
1 ene 1994 año
Máximo:
41.893 billones
1 ene 2016 año
A la fecha de observación
Valor
Cambio absoluto
El cambio con respecto al valor anterior
1 ene 1994 año
335.28 bn
+335.28 bn
0.0%
1 ene 1995 año
483.988 bn
+148.708 bn
44.35%
1 ene 1996 año
448.052 bn
-35.936 bn
-7.43%
1 ene 1997 año
671.182 bn
+223.13 bn
49.8%
1 ene 1998 año
902.691 bn
+231.509 bn
34.49%
1 ene 1999 año
728.929 bn
-173.763 bn
-19.25%
1 ene 2000 año
709.969 bn
-18.96 bn
-2.6%
1 ene 2001 año
1.298 billones
+587.801 bn
82.79%
1 ene 2002 año
953.659 bn
-344.111 bn
-26.52%
1 ene 2003 año
785.118 bn
-168.541 bn
-17.67%
1 ene 2004 año
1.163 billones
+377.538 bn
48.09%
1 ene 2005 año
1.783 billones
+620.321 bn
53.35%
1 ene 2006 año
1.913 billones
+130.358 bn
7.31%
1 ene 2007 año
3.619 billones
+1.705 billones
89.12%
1 ene 2008 año
10.744 billones
+7.126 billones
196.93%
1 ene 2009 año
7.599 billones
-3.146 billones
-29.28%
1 ene 2010 año
11.25 billones
+3.651 billones
48.05%
1 ene 2011 año
12.165 billones
+915.09 bn
8.13%
1 ene 2012 año
9.974 billones
-2.191 billones
-18.01%
1 ene 2013 año
8.117 billones
-1.857 billones
-18.62%
1 ene 2014 año
10.731 billones
+2.614 billones
32.21%
1 ene 2015 año
14.94 billones
+4.209 billones
39.22%
1 ene 2016 año
41.893 billones
+26.953 billones
180.41%
Ranking de los países por los datos estadísticos actuales

Comentarios:

Enviar
PremiumAbout & FeedbackAcuerdoPrivacidad
logo
© 2022 Selected Technologies LLC – Morgan Hill, California