29
/
en
AIzaSyAYiBZKx7MnpbEhh9jyipgxe19OcubqV5w
April 1, 2024
99958
Cameroon
CMR
true
2
1
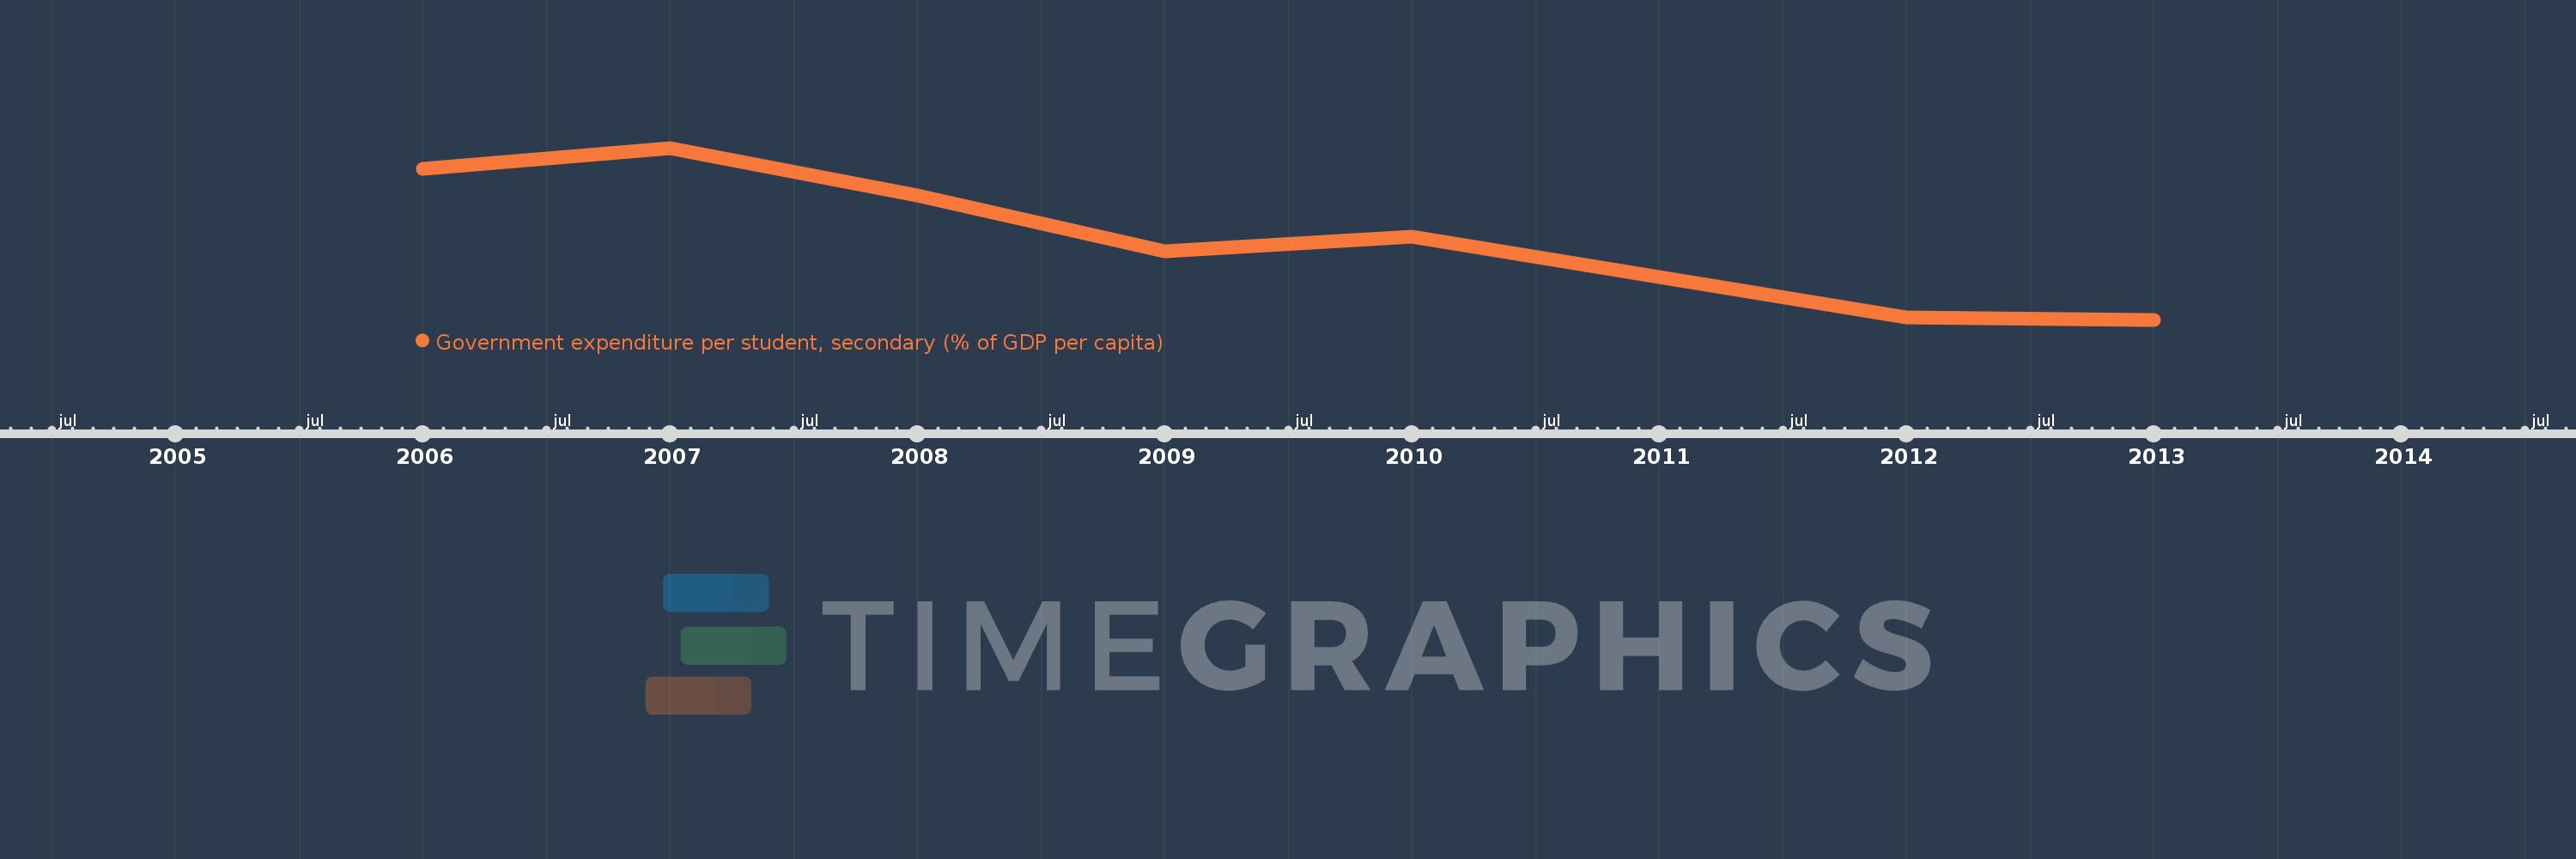
Government expenditure per student, secondary (% of GDP per capita)
2013,2012,2010,2009,2008,2007,2006
This statistics in other country:
Timeline:
This timeline shows a graph from 2006 to 2013 of Cameroon. No data until 2005. Number of actual observations by date: 7.
Source name:
World Development Indicators
Source organization:
United Nations Educational, Scientific, and Cultural Organization (UNESCO) Institute for Statistics.
Categories, topics:
Education
Last updated:
apr 23, 2017
Indicators value changes by year
Maximum:
40.023
jan 1, 2007
At the date of observation
Value
Absolute change
Change from previous value
jan 1, 2006
37.535
+37.535
0.0%
jan 1, 2007
40.023
+2.488
6.63%
jan 1, 2008
34.445
-5.579
-13.94%
jan 1, 2009
27.754
-6.69
-19.42%
jan 1, 2010
29.506
+1.752
6.31%
jan 1, 2012
20.012
-9.494
-32.18%
jan 1, 2013
19.7
-0.313
-1.56%
Ranking of countries by current statistics by years


Comments: