29
/
en
AIzaSyAYiBZKx7MnpbEhh9jyipgxe19OcubqV5w
April 1, 2024
162594
Jamaica
JAM
true
2
1
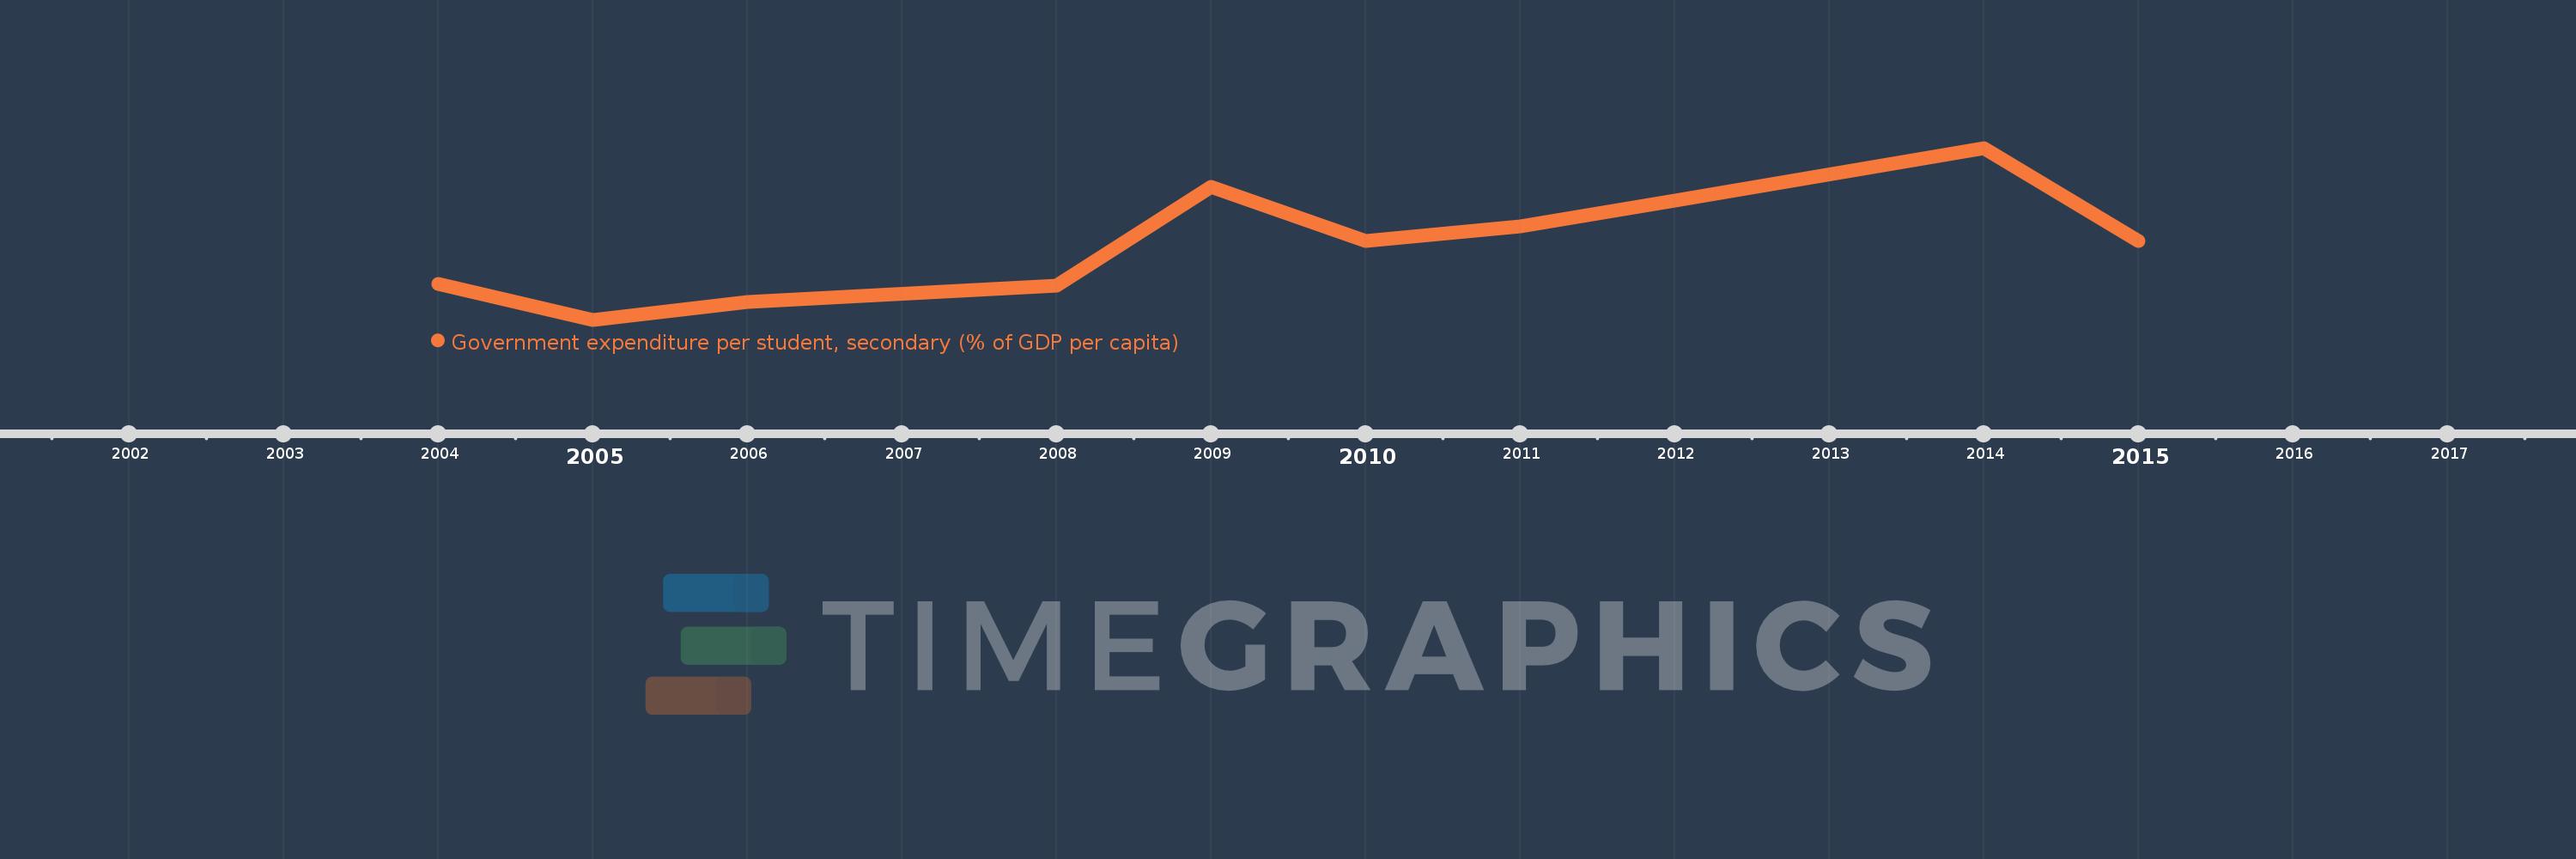
Government expenditure per student, secondary (% of GDP per capita)
2015,2014,2012,2011,2010,2009,2008,2006,2005,2004
This statistics in other country:
Timeline:
This timeline shows a graph from 2004 to 2015 of Jamaica. No data until 2003. Number of actual observations by date: 10.
Source name:
World Development Indicators
Source organization:
United Nations Educational, Scientific, and Cultural Organization (UNESCO) Institute for Statistics.
Categories, topics:
Education
Last updated:
apr 23, 2017
Indicators value changes by year
Minimum:
17.532
jan 1, 2005
Maximum:
29.427
jan 1, 2014
At the date of observation
Value
Absolute change
Change from previous value
jan 1, 2004
20.004
+20.004
0.0%
jan 1, 2005
17.532
-2.472
-12.36%
jan 1, 2006
18.745
+1.213
6.92%
jan 1, 2008
19.917
+1.171
6.25%
jan 1, 2009
26.761
+6.844
34.37%
jan 1, 2010
22.989
-3.772
-14.09%
jan 1, 2011
23.993
+1.004
4.37%
jan 1, 2012
25.775
+1.782
7.43%
jan 1, 2014
29.427
+3.652
14.17%
jan 1, 2015
22.976
-6.45
-21.92%
Ranking of countries by current statistics by years


Comments: