29
/
en
AIzaSyAYiBZKx7MnpbEhh9jyipgxe19OcubqV5w
April 1, 2024
157322
Iran, Islamic Rep.
IRN
true
2
1
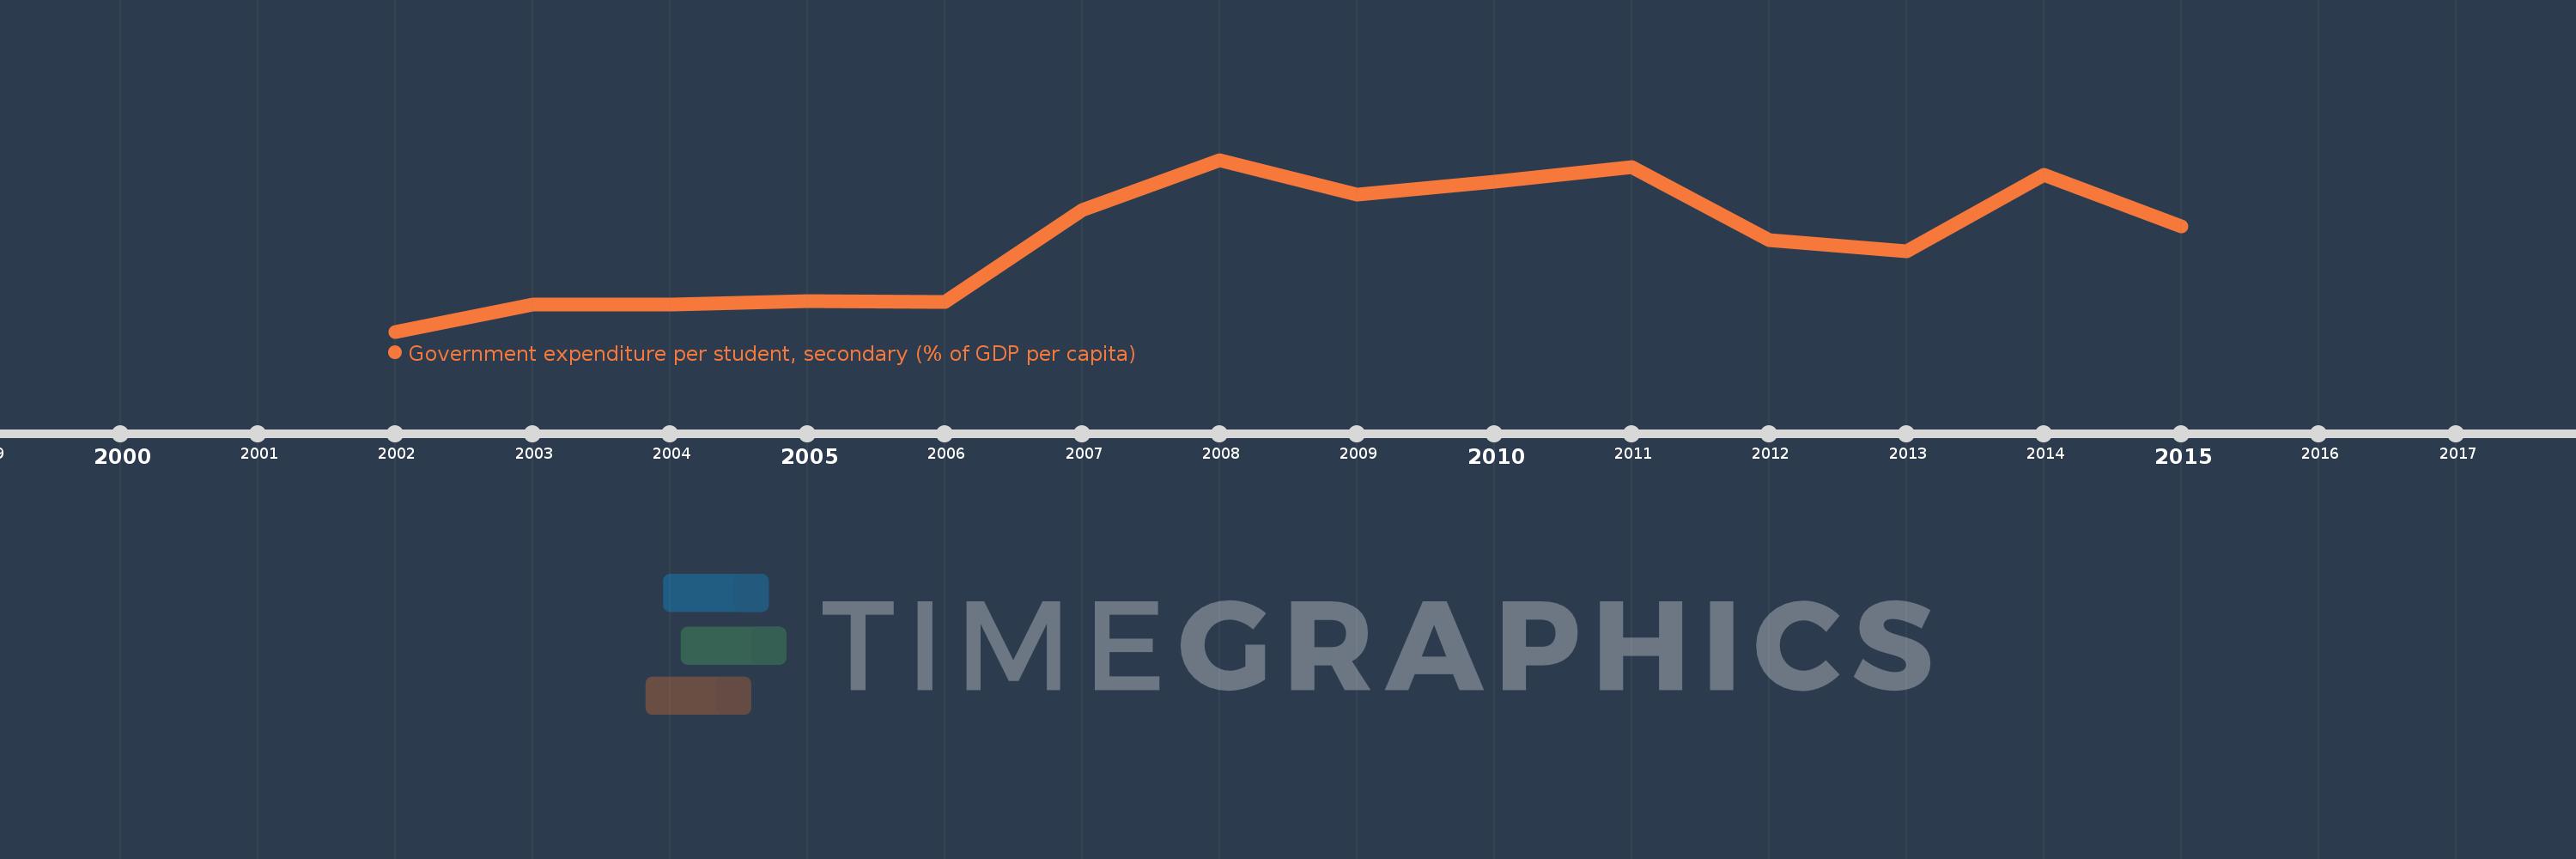
Government expenditure per student, secondary (% of GDP per capita)
2015,2014,2013,2012,2011,2010,2009,2008,2007,2006,2005,2004,2003,2002
This statistics in other country:
Timeline:
This timeline shows a graph from 2002 to 2015 of Iran, Islamic Rep.. No data until 2001. Number of actual observations by date: 14.
Source name:
World Development Indicators
Source organization:
United Nations Educational, Scientific, and Cultural Organization (UNESCO) Institute for Statistics.
Categories, topics:
Education
Last updated:
apr 23, 2017
Indicators value changes by year
Maximum:
19.423
jan 1, 2008
At the date of observation
Value
Absolute change
Change from previous value
jan 1, 2002
9.399
+9.399
0.0%
jan 1, 2003
10.978
+1.579
16.8%
jan 1, 2004
10.96
-0.018
-0.16%
jan 1, 2005
11.19
+0.23
2.1%
jan 1, 2006
11.11
-0.08
-0.71%
jan 1, 2007
16.487
+5.377
48.39%
jan 1, 2008
19.423
+2.936
17.81%
jan 1, 2009
17.377
-2.046
-10.53%
jan 1, 2010
18.146
+0.769
4.43%
jan 1, 2011
19.013
+0.867
4.78%
jan 1, 2012
14.745
-4.268
-22.45%
jan 1, 2013
14.11
-0.635
-4.31%
jan 1, 2014
18.522
+4.413
31.27%
jan 1, 2015
15.533
-2.989
-16.14%
Ranking of countries by current statistics by years


Comments: