29
/
en
AIzaSyAYiBZKx7MnpbEhh9jyipgxe19OcubqV5w
April 1, 2024
35766
High income
HIC
false
2
1
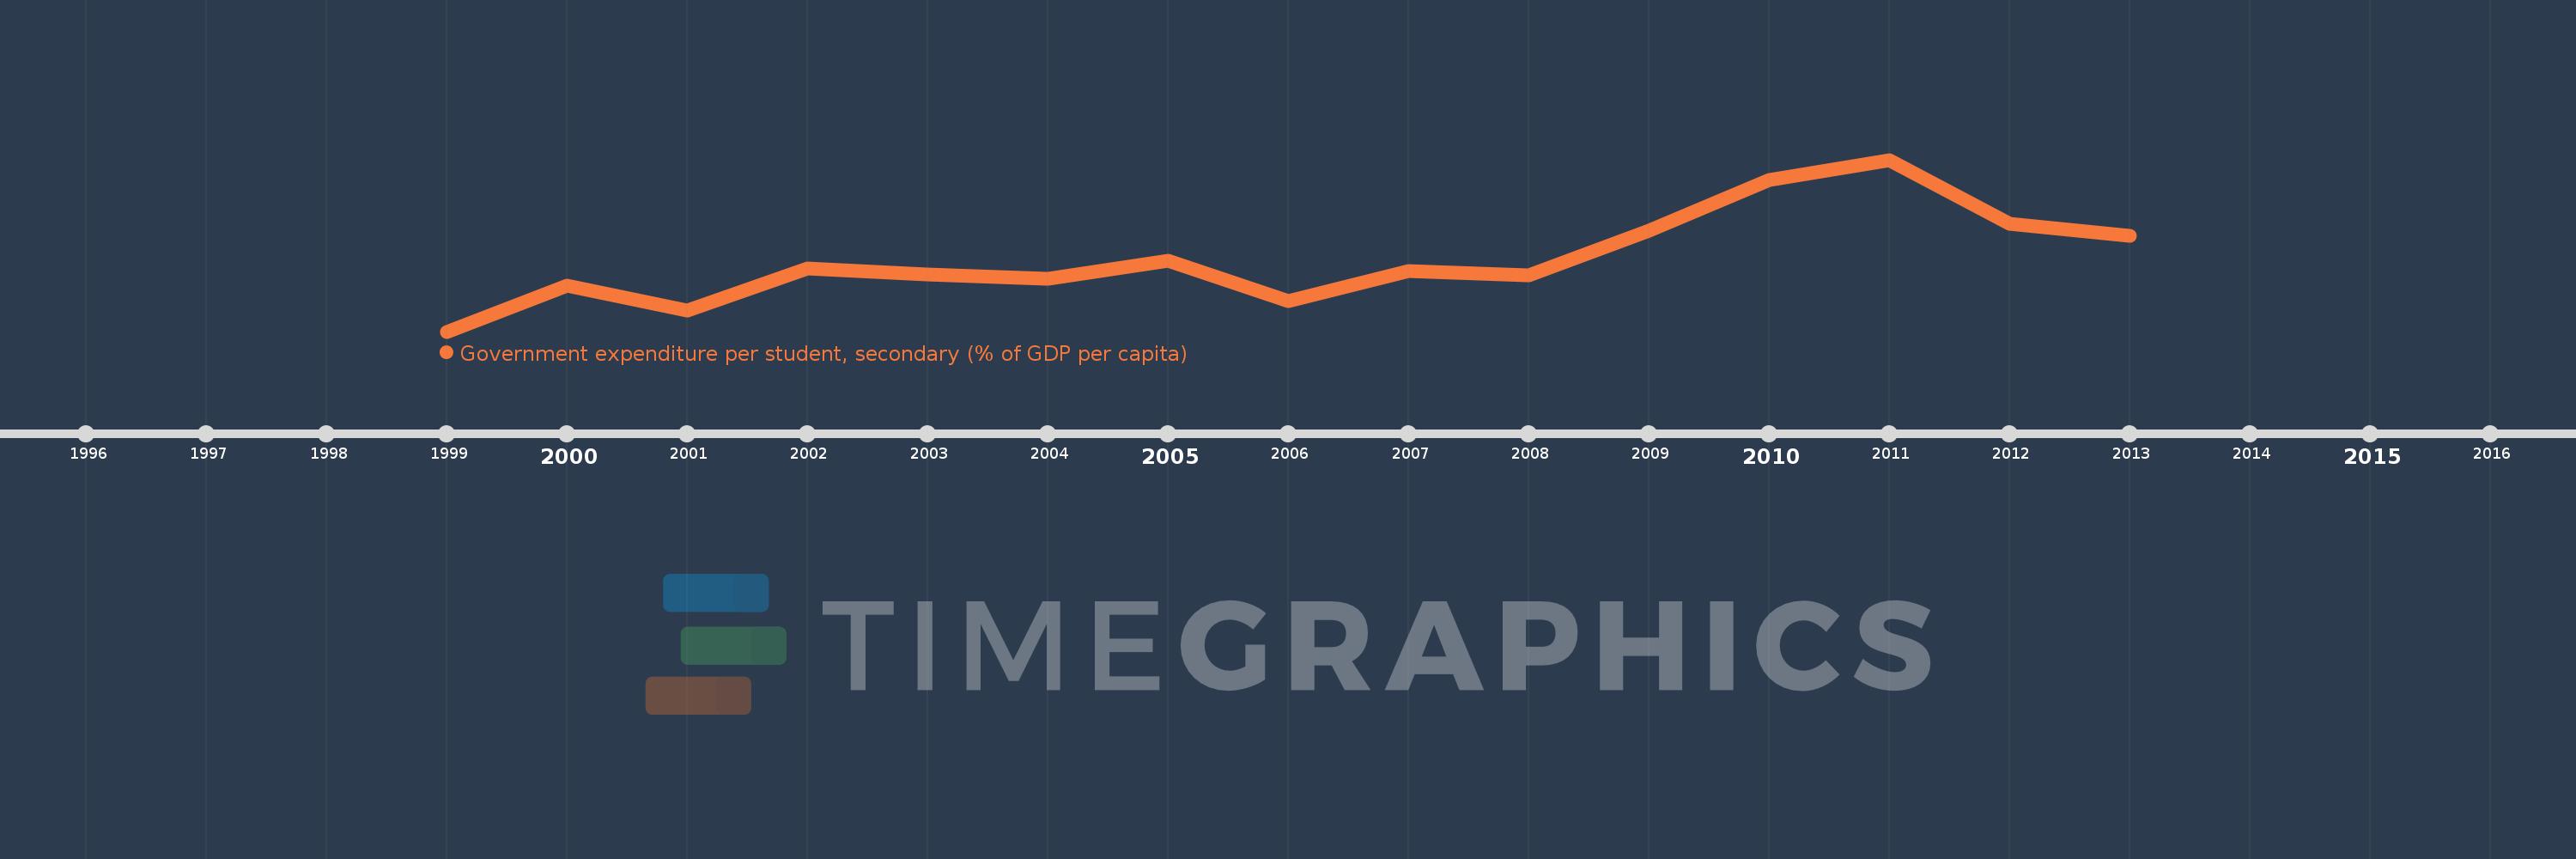
Government expenditure per student, secondary (% of GDP per capita)
2013,2012,2011,2010,2009,2008,2007,2006,2005,2004,2003,2002,2001,2000,1999
This statistics in other country:
Timeline:
This timeline shows a graph from 1999 to 2013 of High income. No data until 1998. Number of actual observations by date: 15.
Source name:
World Development Indicators
Source organization:
United Nations Educational, Scientific, and Cultural Organization (UNESCO) Institute for Statistics.
Categories, topics:
Education
Last updated:
apr 23, 2017
Indicators value changes by year
Minimum:
21.368
jan 1, 1999
Maximum:
25.758
jan 1, 2011
At the date of observation
Value
Absolute change
Change from previous value
jan 1, 1999
21.368
+21.368
0.0%
jan 1, 2000
22.532
+1.164
5.45%
jan 1, 2001
21.906
-0.627
-2.78%
jan 1, 2002
22.989
+1.083
4.94%
jan 1, 2003
22.83
-0.158
-0.69%
jan 1, 2004
22.714
-0.116
-0.51%
jan 1, 2005
23.182
+0.468
2.06%
jan 1, 2006
22.152
-1.03
-4.44%
jan 1, 2007
22.92
+0.769
3.47%
jan 1, 2008
22.808
-0.113
-0.49%
jan 1, 2009
23.941
+1.134
4.97%
jan 1, 2010
25.244
+1.303
5.44%
jan 1, 2011
25.758
+0.514
2.03%
jan 1, 2012
24.121
-1.637
-6.35%
jan 1, 2013
23.823
-0.298
-1.24%
Ranking of countries by current statistics by years


Comments: