29
/
en
AIzaSyAYiBZKx7MnpbEhh9jyipgxe19OcubqV5w
April 1, 2024
30709
Europe & Central Asia
ECS
false
2
1
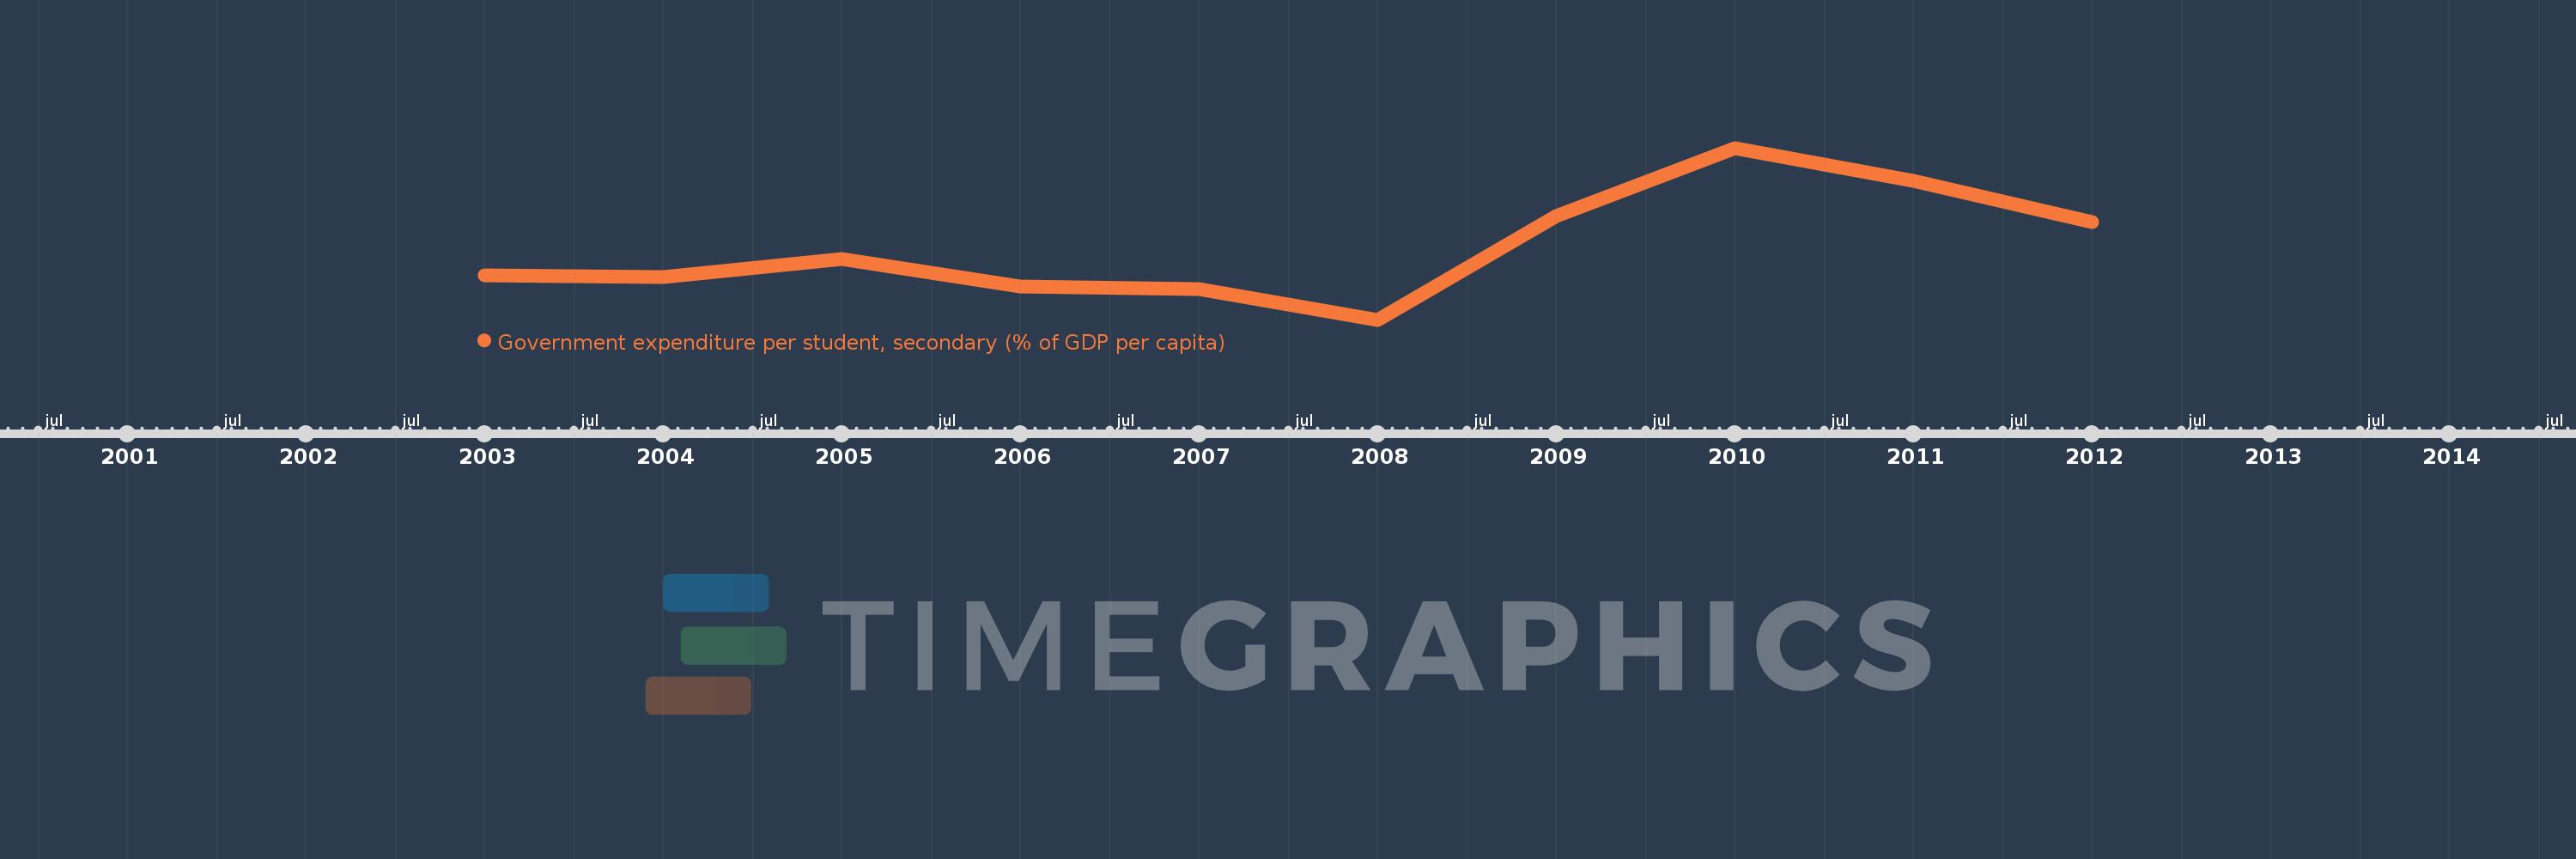
Government expenditure per student, secondary (% of GDP per capita)
2012,2011,2010,2009,2008,2007,2006,2005,2004,2003
This statistics in other country:
Timeline:
This timeline shows a graph from 2003 to 2012 of Europe & Central Asia. No data until 2002. Number of actual observations by date: 10.
Source name:
World Development Indicators
Source organization:
United Nations Educational, Scientific, and Cultural Organization (UNESCO) Institute for Statistics.
Categories, topics:
Education
Last updated:
apr 23, 2017
Indicators value changes by year
Minimum:
22.997
jan 1, 2008
Maximum:
28.322
jan 1, 2010
At the date of observation
Value
Absolute change
Change from previous value
jan 1, 2003
24.369
+24.369
0.0%
jan 1, 2004
24.323
-0.046
-0.19%
jan 1, 2005
24.892
+0.569
2.34%
jan 1, 2006
24.039
-0.853
-3.43%
jan 1, 2007
23.939
-0.099
-0.41%
jan 1, 2008
22.997
-0.942
-3.94%
jan 1, 2009
26.202
+3.205
13.94%
jan 1, 2010
28.322
+2.121
8.09%
jan 1, 2011
27.295
-1.027
-3.63%
jan 1, 2012
26.014
-1.281
-4.69%
Ranking of countries by current statistics by years


Comments: