29
/
en
AIzaSyAYiBZKx7MnpbEhh9jyipgxe19OcubqV5w
April 1, 2024
214348
Norway
NOR
true
2
1
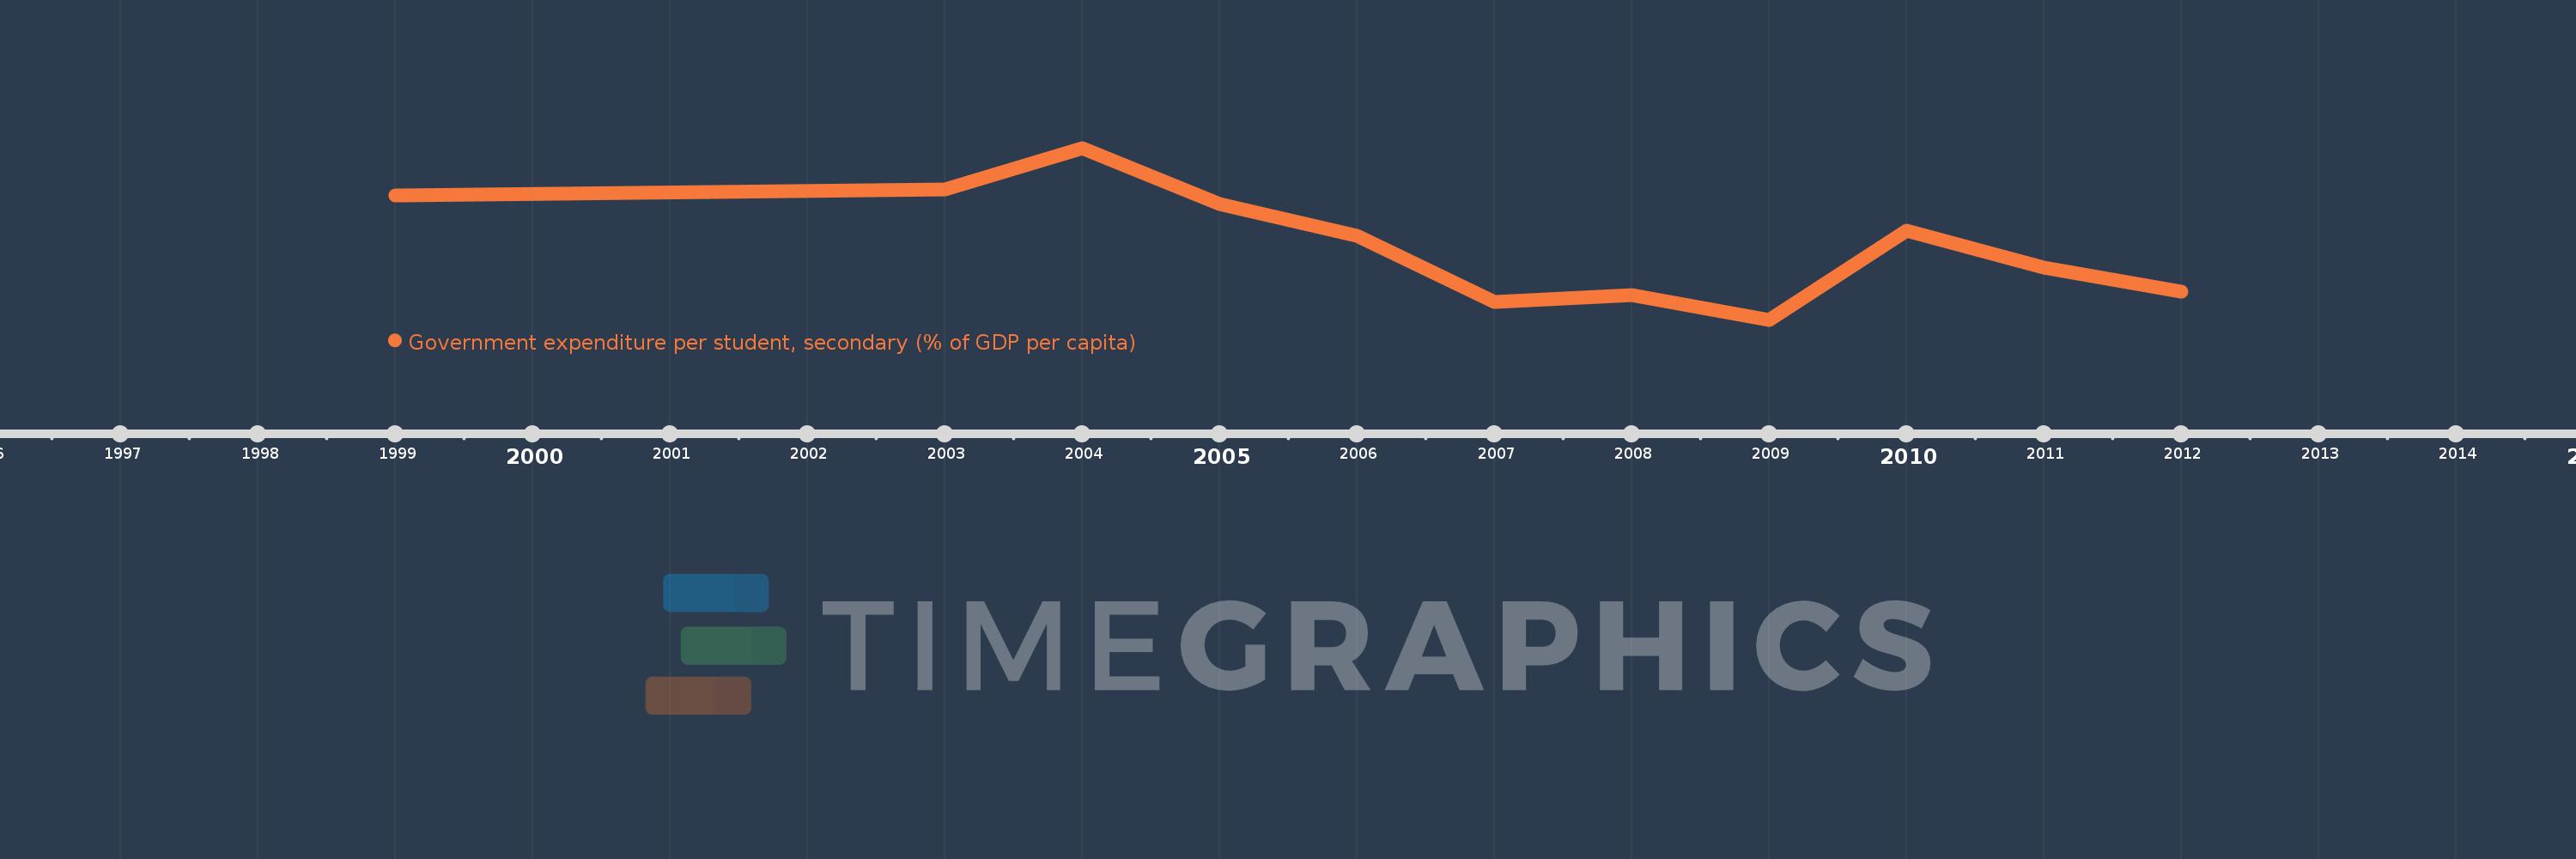
Government expenditure per student, secondary (% of GDP per capita)
2012,2011,2010,2009,2008,2007,2006,2005,2004,2003,1999
This statistics in other country:
Timeline:
This timeline shows a graph from 1999 to 2012 of Norway. No data until 1998. Number of actual observations by date: 11.
Source name:
World Development Indicators
Source organization:
United Nations Educational, Scientific, and Cultural Organization (UNESCO) Institute for Statistics.
Categories, topics:
Education
Last updated:
apr 23, 2017
Indicators value changes by year
Minimum:
24.646
jan 1, 2009
Maximum:
31.712
jan 1, 2004
At the date of observation
Value
Absolute change
Change from previous value
jan 1, 1999
29.753
+29.753
0.0%
jan 1, 2003
29.991
+0.237
0.8%
jan 1, 2004
31.712
+1.721
5.74%
jan 1, 2005
29.408
-2.304
-7.27%
jan 1, 2006
28.105
-1.303
-4.43%
jan 1, 2007
25.369
-2.736
-9.74%
jan 1, 2008
25.645
+0.276
1.09%
jan 1, 2009
24.646
-0.999
-3.9%
jan 1, 2010
28.322
+3.676
14.92%
jan 1, 2011
26.799
-1.523
-5.38%
jan 1, 2012
25.786
-1.014
-3.78%
Ranking of countries by current statistics by years


Comments: