29
/
en
AIzaSyAYiBZKx7MnpbEhh9jyipgxe19OcubqV5w
April 1, 2024
182117
Luxembourg
LUX
true
2
1
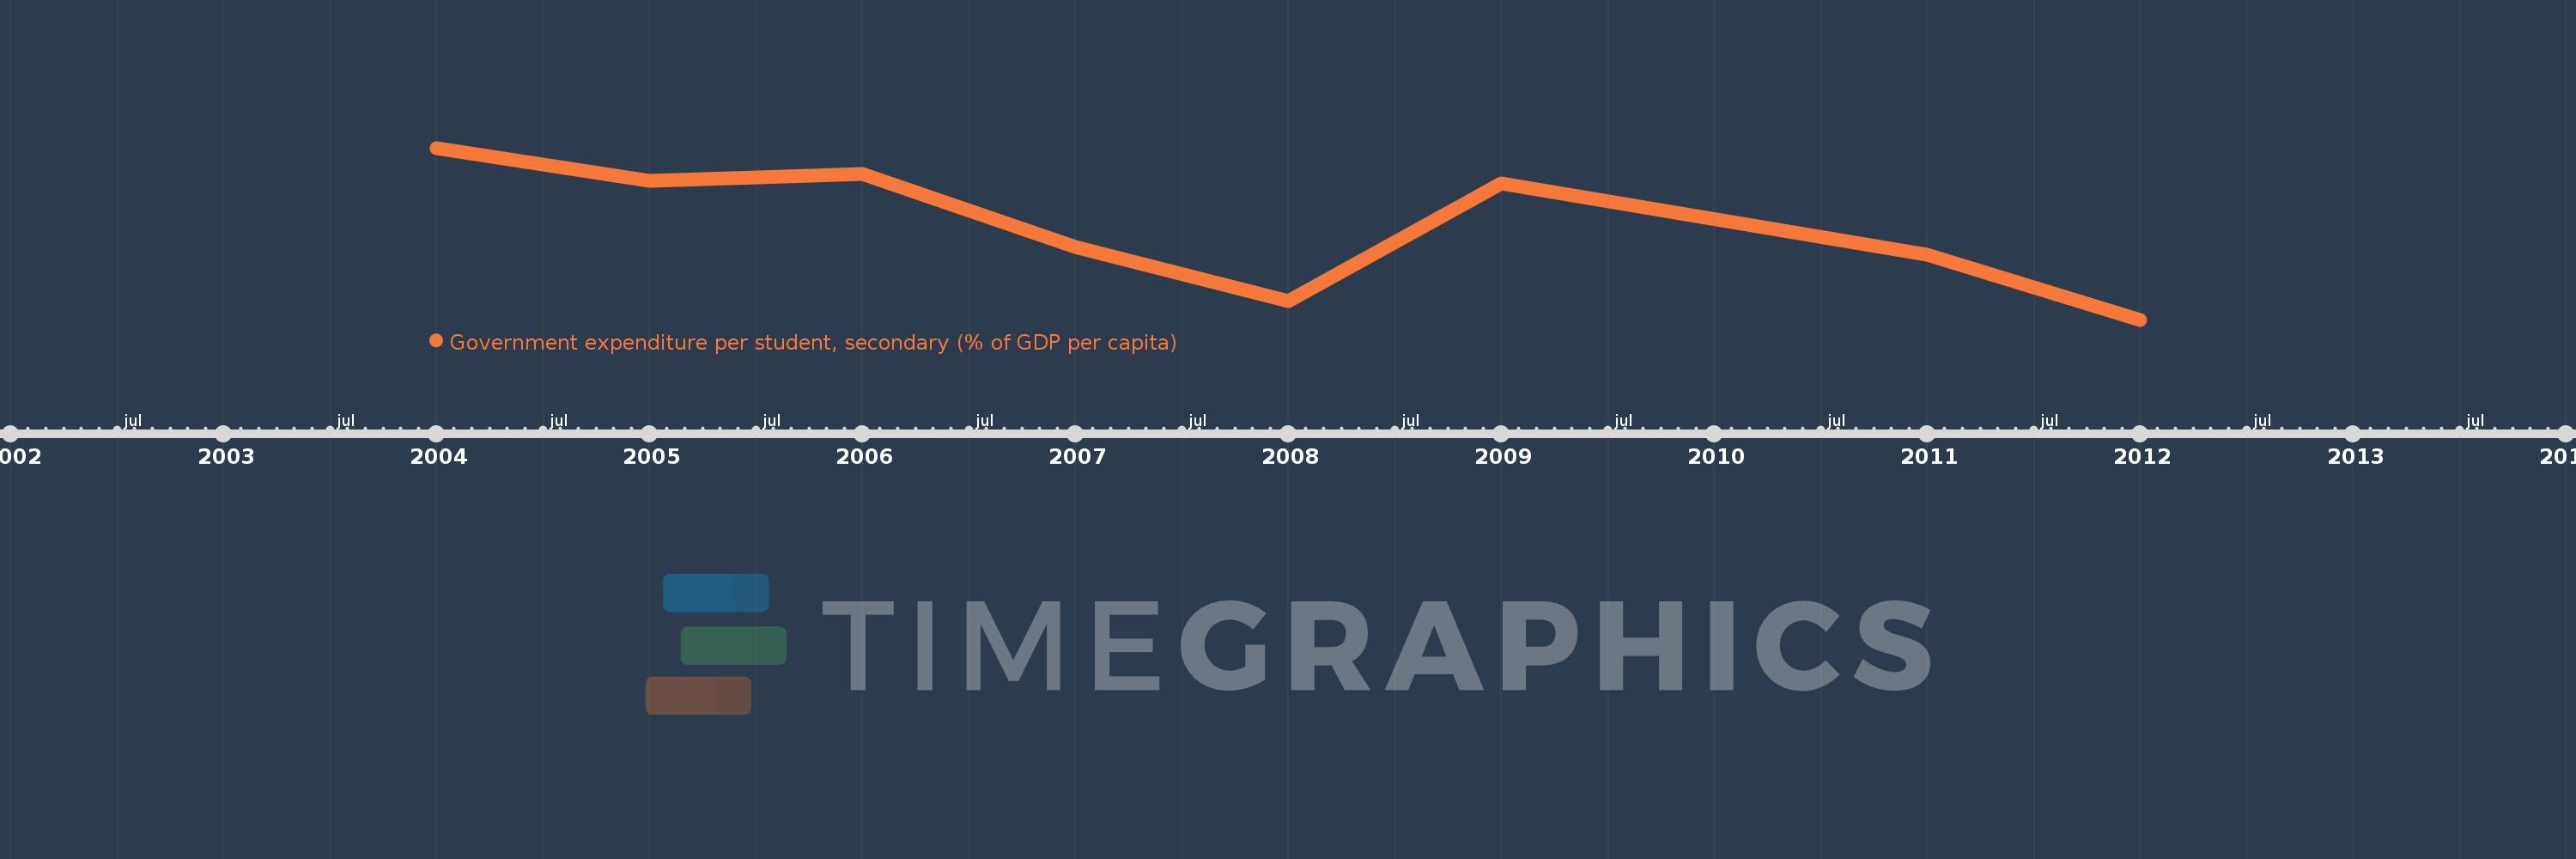
Government expenditure per student, secondary (% of GDP per capita)
2012,2011,2009,2008,2007,2006,2005,2004
This statistics in other country:
Timeline:
This timeline shows a graph from 2004 to 2012 of Luxembourg. No data until 2003. Number of actual observations by date: 8.
Source name:
World Development Indicators
Source organization:
United Nations Educational, Scientific, and Cultural Organization (UNESCO) Institute for Statistics.
Categories, topics:
Education
Last updated:
apr 23, 2017
Indicators value changes by year
Maximum:
23.687
jan 1, 2004
At the date of observation
Value
Absolute change
Change from previous value
jan 1, 2004
23.687
+23.687
0.0%
jan 1, 2005
22.611
-1.077
-4.55%
jan 1, 2006
22.83
+0.219
0.97%
jan 1, 2007
20.463
-2.367
-10.37%
jan 1, 2008
18.714
-1.748
-8.54%
jan 1, 2009
22.544
+3.83
20.46%
jan 1, 2011
20.223
-2.321
-10.3%
jan 1, 2012
18.1
-2.122
-10.49%
Ranking of countries by current statistics by years


Comments: