29
/
en
AIzaSyAYiBZKx7MnpbEhh9jyipgxe19OcubqV5w
April 1, 2024
69848
Argentina
ARG
true
2
1
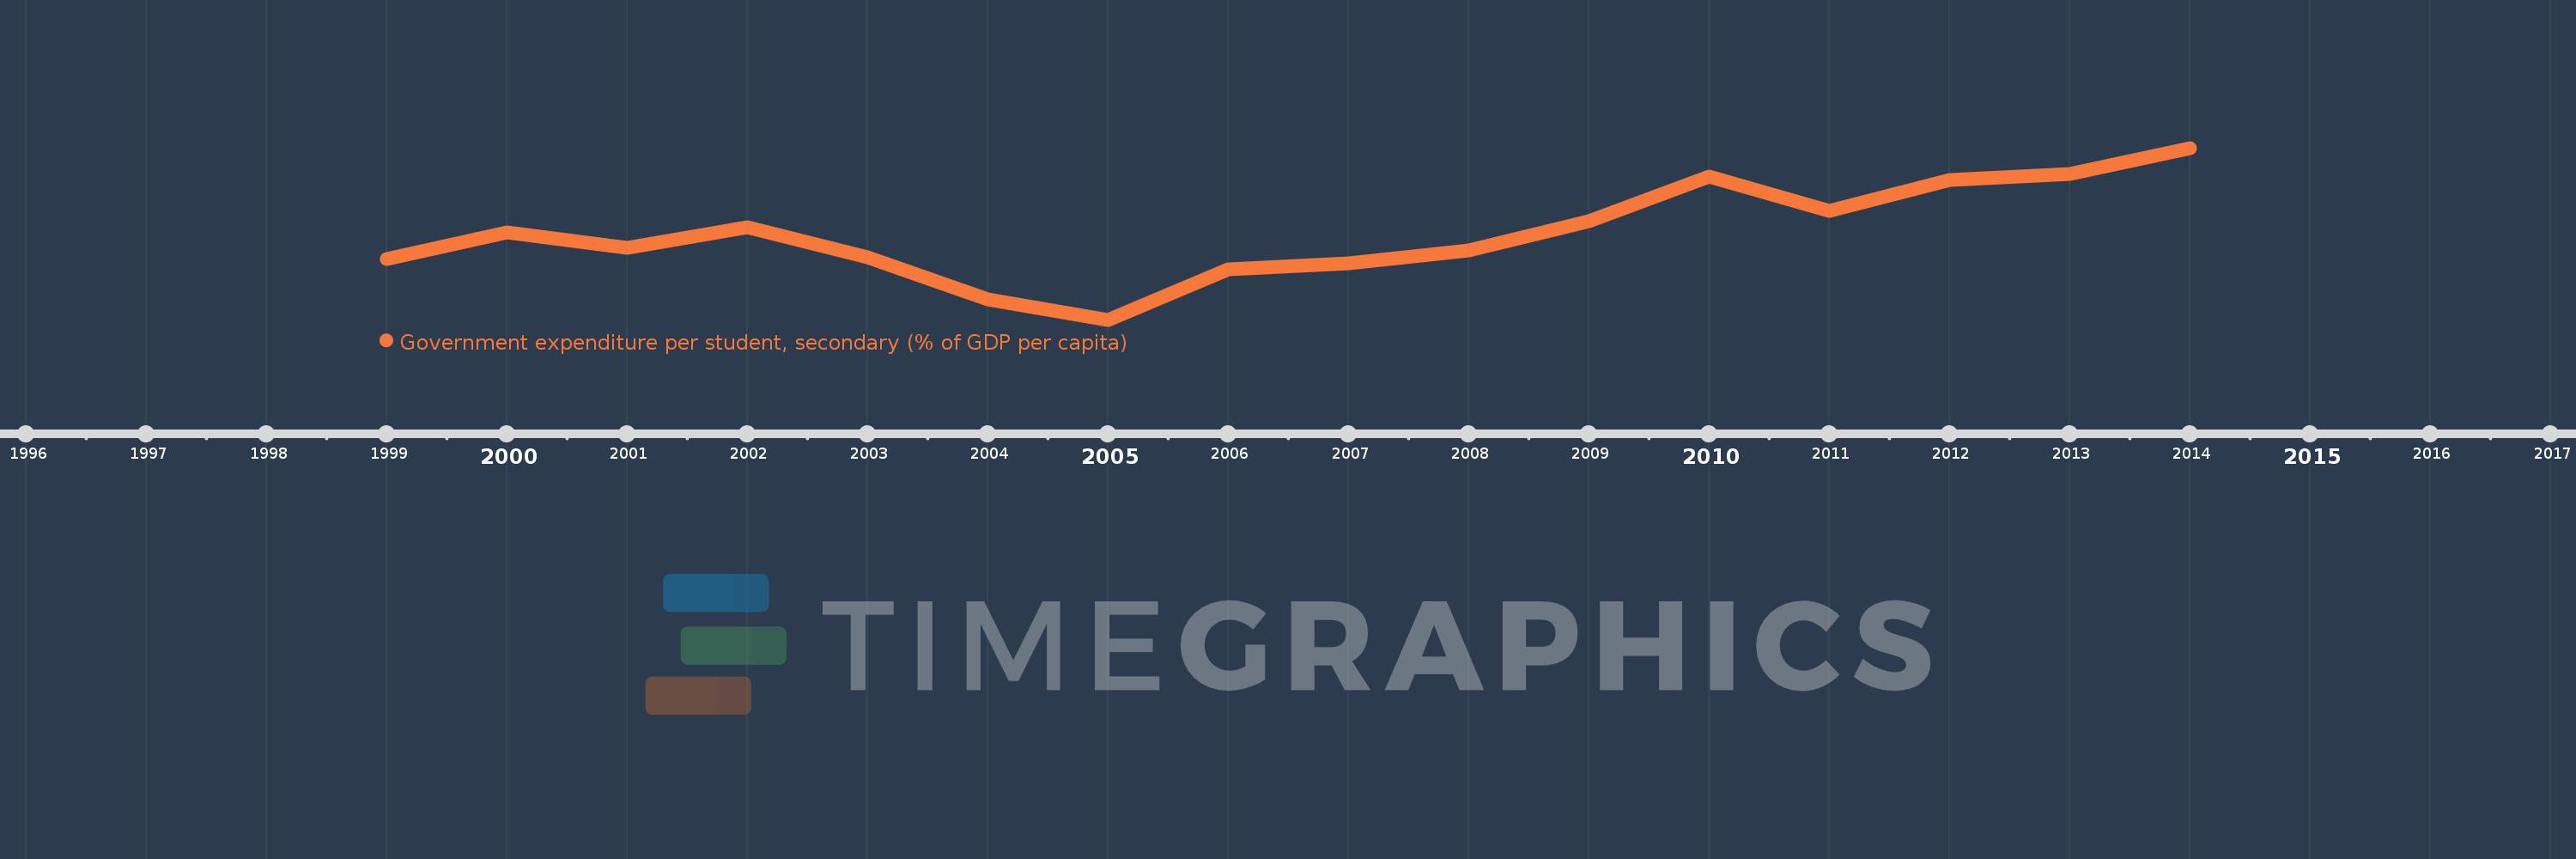
Government expenditure per student, secondary (% of GDP per capita)
2014,2013,2012,2011,2010,2009,2008,2007,2006,2005,2004,2003,2002,2001,2000,1999
This statistics in other country:
Timeline:
This timeline shows a graph from 1999 to 2014 of Argentina. No data until 1998. Number of actual observations by date: 16.
Source name:
World Development Indicators
Source organization:
United Nations Educational, Scientific, and Cultural Organization (UNESCO) Institute for Statistics.
Categories, topics:
Education
Last updated:
apr 23, 2017
Indicators value changes by year
Minimum:
11.789
jan 1, 2005
Maximum:
21.426
jan 1, 2014
At the date of observation
Value
Absolute change
Change from previous value
jan 1, 1999
15.189
+15.189
0.0%
jan 1, 2000
16.683
+1.494
9.84%
jan 1, 2001
15.825
-0.858
-5.14%
jan 1, 2002
16.989
+1.163
7.35%
jan 1, 2003
15.295
-1.693
-9.97%
jan 1, 2004
12.932
-2.364
-15.45%
jan 1, 2005
11.789
-1.143
-8.84%
jan 1, 2006
14.595
+2.806
23.8%
jan 1, 2007
14.941
+0.346
2.37%
jan 1, 2008
15.684
+0.743
4.97%
jan 1, 2009
17.321
+1.637
10.44%
jan 1, 2010
19.811
+2.49
14.38%
jan 1, 2011
17.87
-1.94
-9.8%
jan 1, 2012
19.644
+1.773
9.92%
jan 1, 2013
19.97
+0.327
1.66%
jan 1, 2014
21.426
+1.455
7.29%
Ranking of countries by current statistics by years


Comments: