29
/
en
AIzaSyAYiBZKx7MnpbEhh9jyipgxe19OcubqV5w
April 1, 2024
264639
Togo
TGO
true
2
1
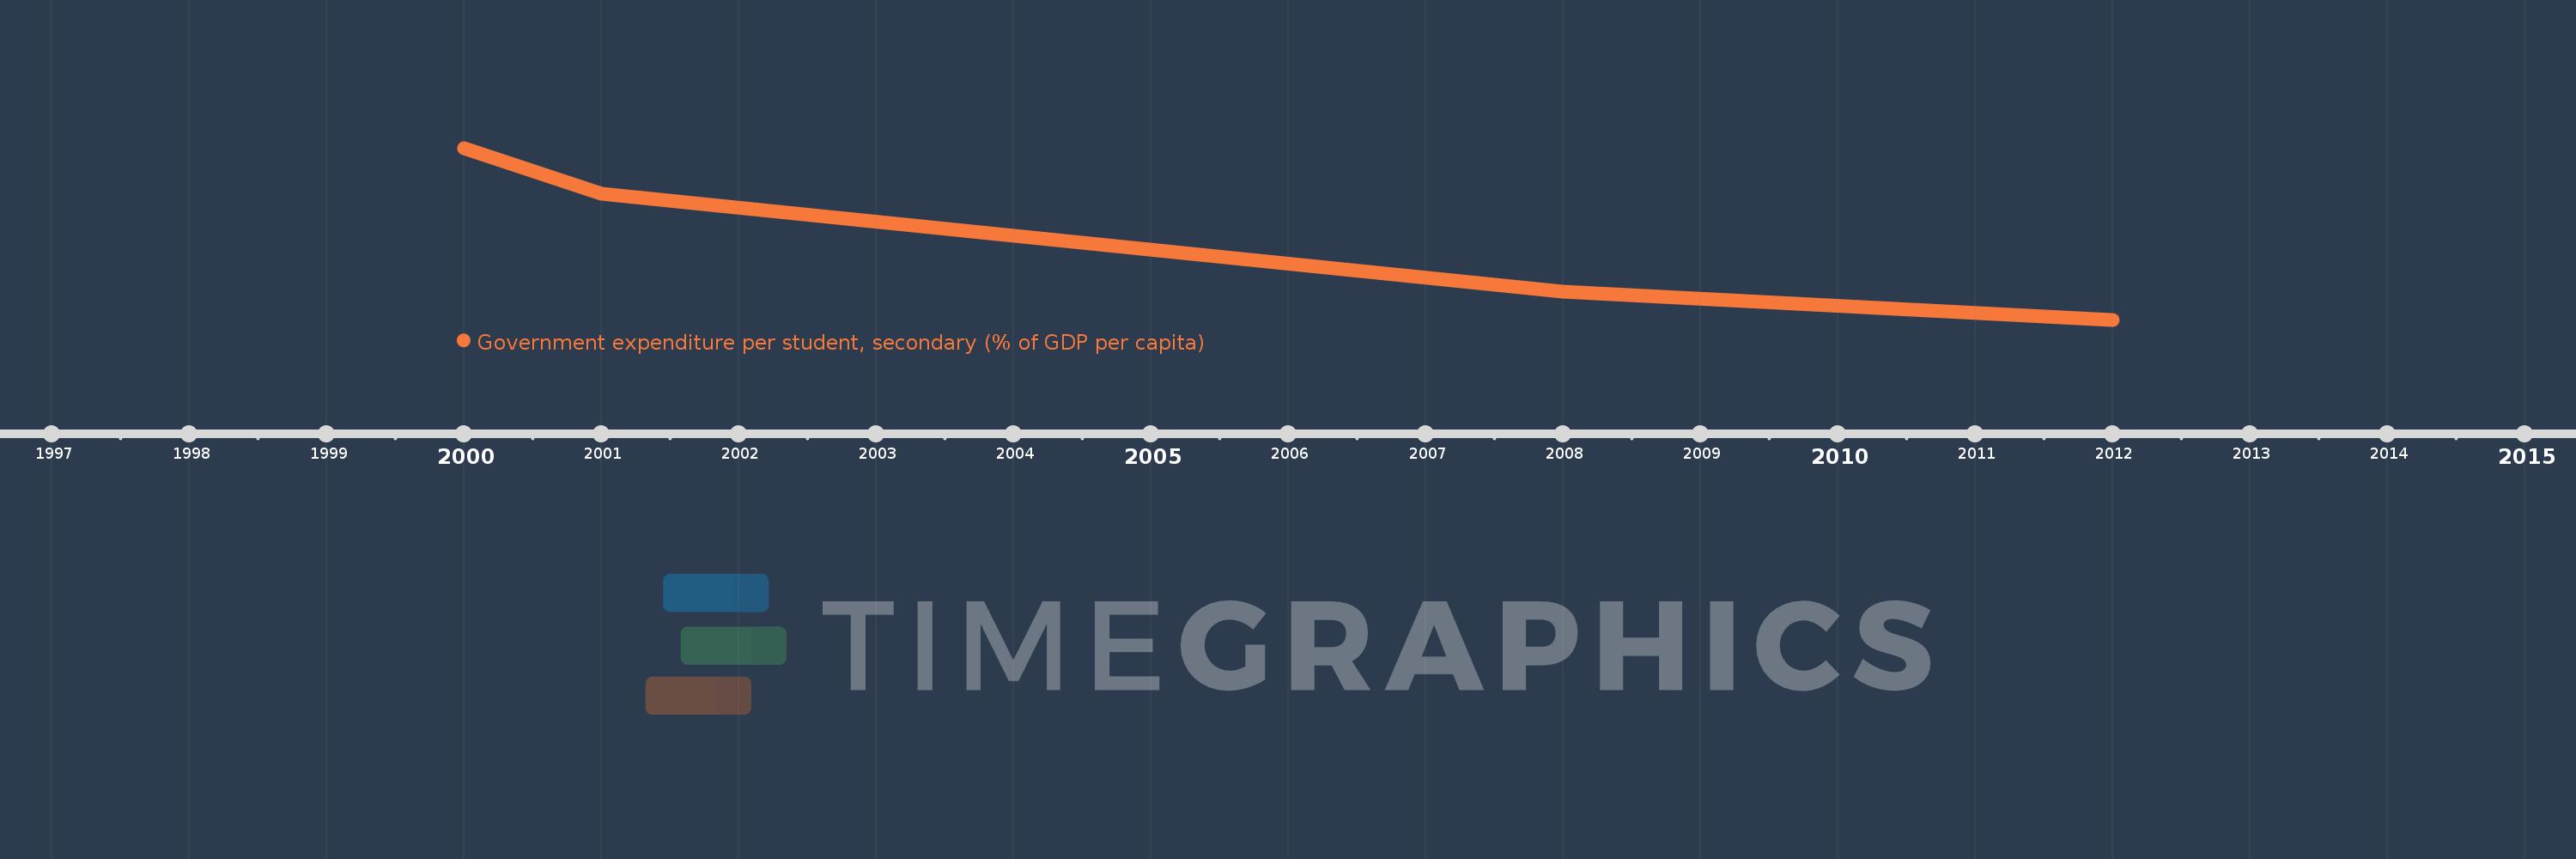
Government expenditure per student, secondary (% of GDP per capita)
2012,2008,2001,2000
This statistics in other country:
Timeline:
This timeline shows a graph from 2000 to 2012 of Togo. No data until 1999. Number of actual observations by date: 4.
Source name:
World Development Indicators
Source organization:
United Nations Educational, Scientific, and Cultural Organization (UNESCO) Institute for Statistics.
Categories, topics:
Education
Last updated:
apr 23, 2017
Indicators value changes by year
Minimum:
15.644
jan 1, 2012
Maximum:
28.289
jan 1, 2000
At the date of observation
Value
Absolute change
Change from previous value
jan 1, 2000
28.289
+28.289
0.0%
jan 1, 2001
24.905
-3.384
-11.96%
jan 1, 2008
17.721
-7.184
-28.85%
jan 1, 2012
15.644
-2.077
-11.72%
Ranking of countries by current statistics by years


Comments: