29
/
en
AIzaSyAYiBZKx7MnpbEhh9jyipgxe19OcubqV5w
April 1, 2024
115828
Cuba
CUB
true
2
1
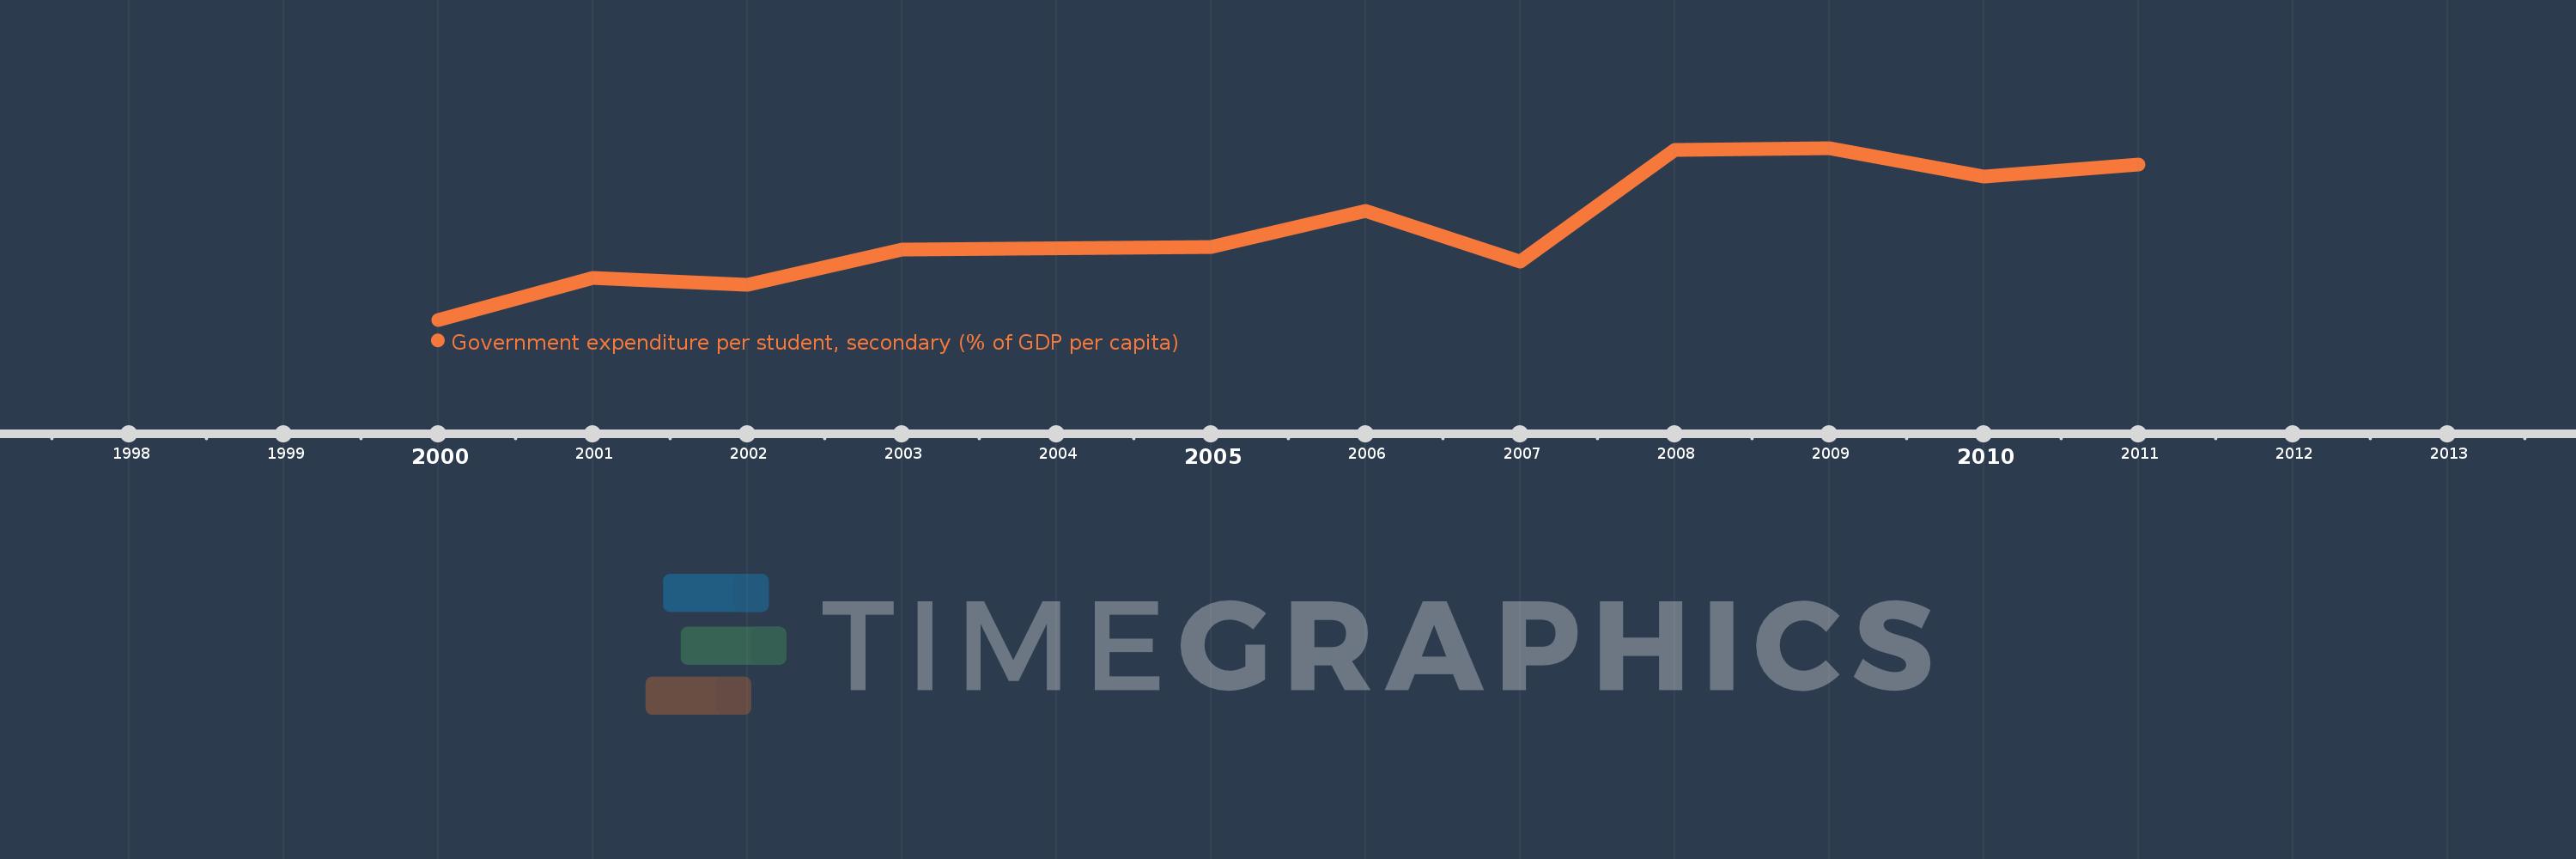
Government expenditure per student, secondary (% of GDP per capita)
2011,2010,2009,2008,2007,2006,2005,2003,2002,2001,2000
This statistics in other country:
Timeline:
This timeline shows a graph from 2000 to 2011 of Cuba. No data until 1999. Number of actual observations by date: 11.
Source name:
World Development Indicators
Source organization:
United Nations Educational, Scientific, and Cultural Organization (UNESCO) Institute for Statistics.
Categories, topics:
Education
Last updated:
apr 23, 2017
Indicators value changes by year
Minimum:
37.118
jan 1, 2000
Maximum:
53.882
jan 1, 2009
At the date of observation
Value
Absolute change
Change from previous value
jan 1, 2000
37.118
+37.118
0.0%
jan 1, 2001
41.163
+4.045
10.9%
jan 1, 2002
40.539
-0.624
-1.52%
jan 1, 2003
44.006
+3.467
8.55%
jan 1, 2005
44.197
+0.191
0.44%
jan 1, 2006
47.77
+3.573
8.08%
jan 1, 2007
42.758
-5.013
-10.49%
jan 1, 2008
53.667
+10.909
25.51%
jan 1, 2009
53.882
+0.216
0.4%
jan 1, 2010
51.057
-2.825
-5.24%
jan 1, 2011
52.237
+1.18
2.31%
Ranking of countries by current statistics by years


Comments: