29
/
en
AIzaSyAYiBZKx7MnpbEhh9jyipgxe19OcubqV5w
April 1, 2024
215313
Oman
OMN
true
2
1
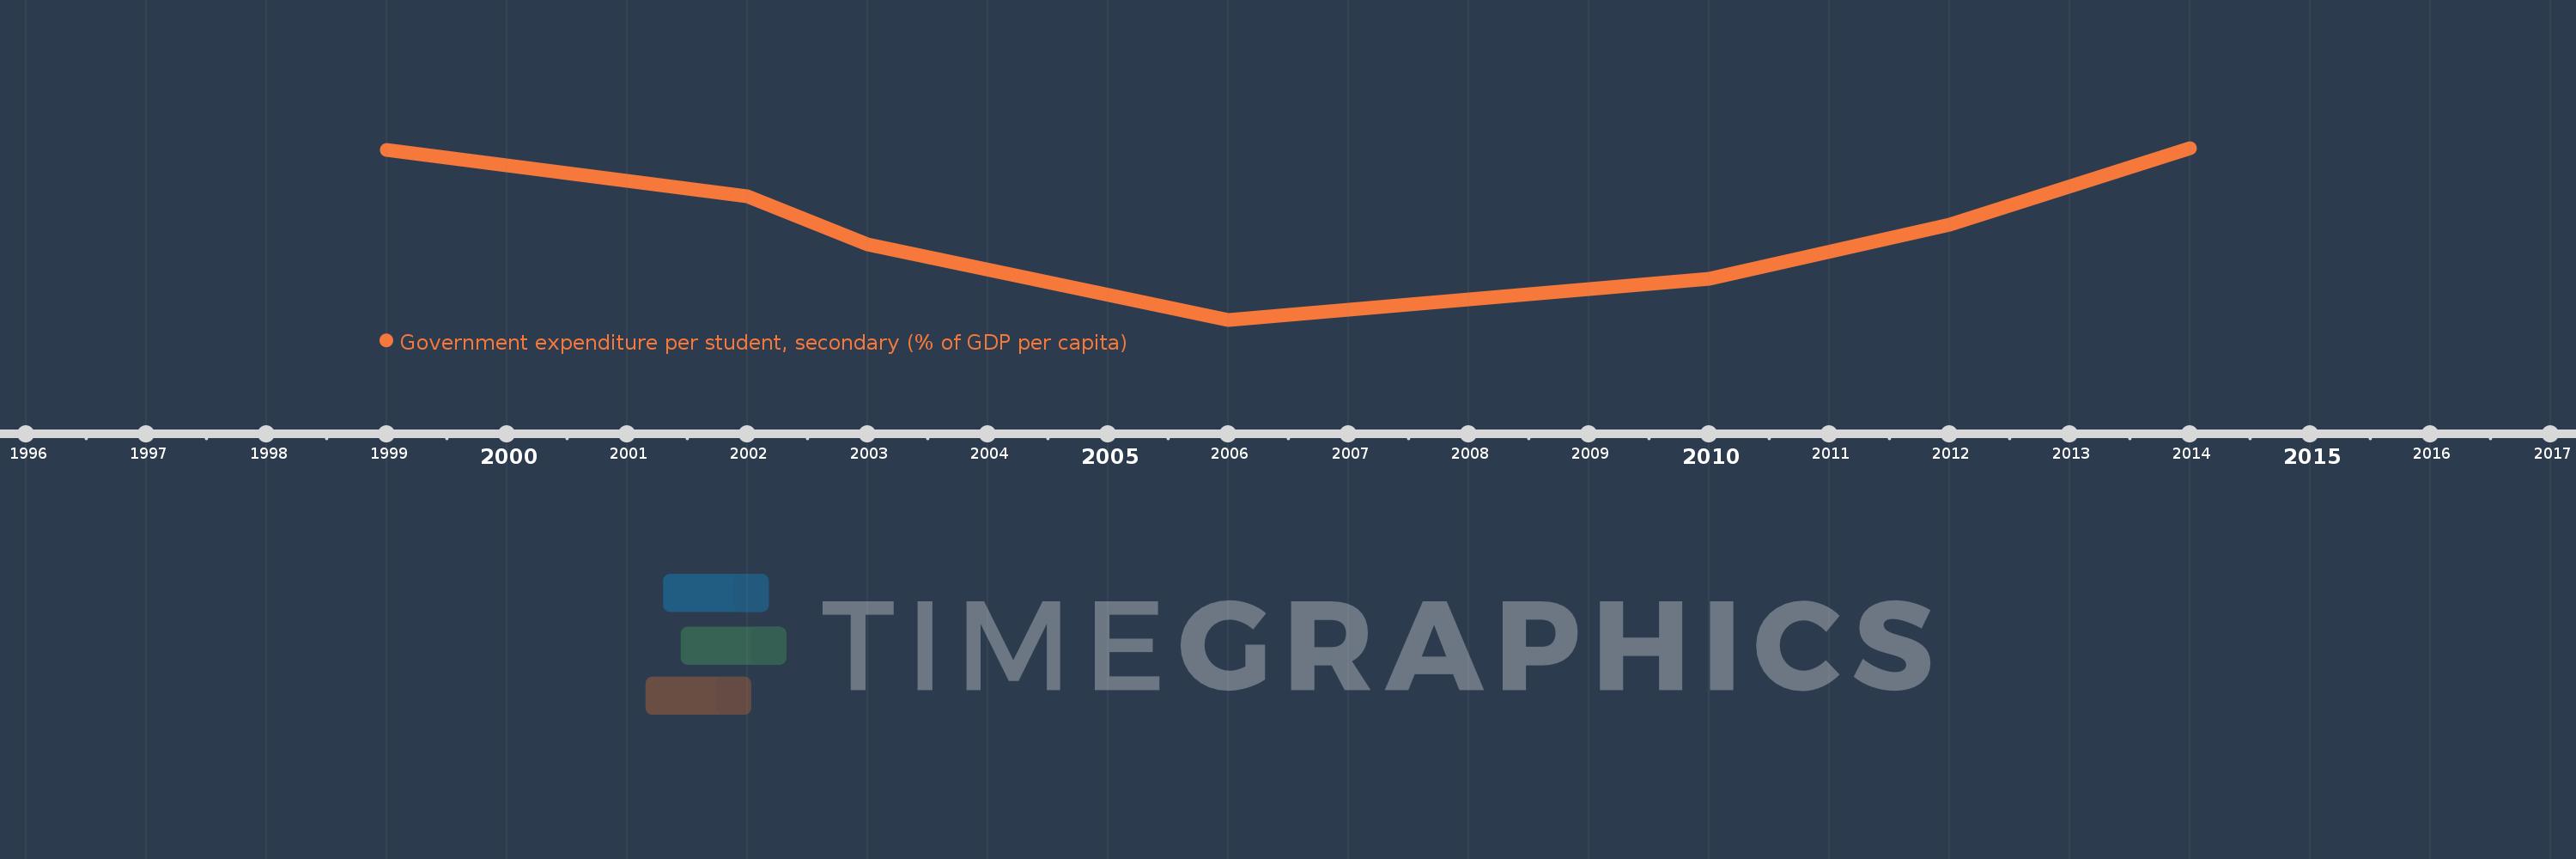
Government expenditure per student, secondary (% of GDP per capita)
2014,2012,2010,2006,2003,2002,2000,1999
This statistics in other country:
Timeline:
This timeline shows a graph from 1999 to 2014 of Oman. No data until 1998. Number of actual observations by date: 8.
Source name:
World Development Indicators
Source organization:
United Nations Educational, Scientific, and Cultural Organization (UNESCO) Institute for Statistics.
Categories, topics:
Education
Last updated:
apr 23, 2017
Indicators value changes by year
Minimum:
12.229
jan 1, 2006
Maximum:
21.478
jan 1, 2014
At the date of observation
Value
Absolute change
Change from previous value
jan 1, 1999
21.368
+21.368
0.0%
jan 1, 2000
20.553
-0.815
-3.81%
jan 1, 2002
18.881
-1.671
-8.13%
jan 1, 2003
16.264
-2.617
-13.86%
jan 1, 2006
12.229
-4.035
-24.81%
jan 1, 2010
14.442
+2.213
18.09%
jan 1, 2012
17.369
+2.927
20.27%
jan 1, 2014
21.478
+4.109
23.66%
Ranking of countries by current statistics by years


Comments: