29
/
en
AIzaSyAYiBZKx7MnpbEhh9jyipgxe19OcubqV5w
April 1, 2024
78282
Bangladesh
BGD
true
2
1
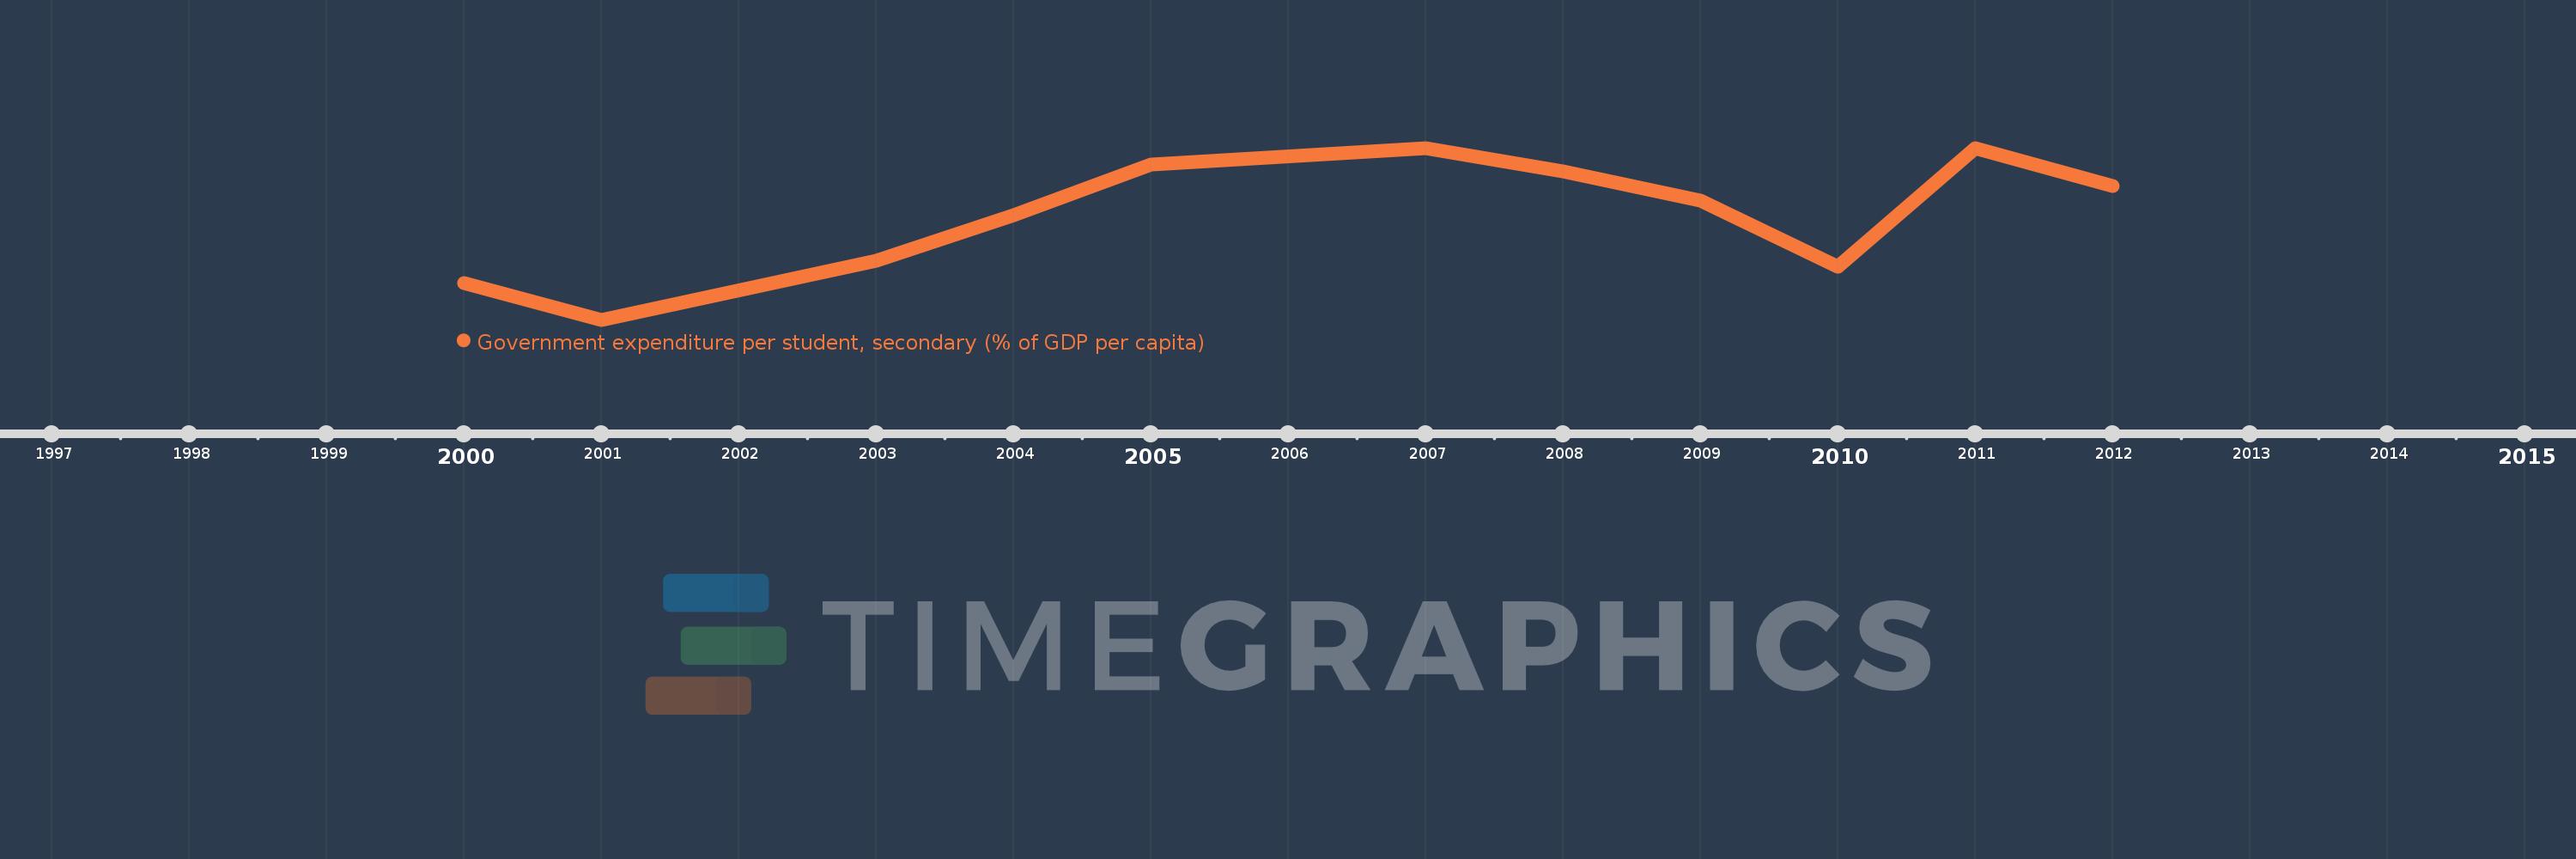
Government expenditure per student, secondary (% of GDP per capita)
2012,2011,2010,2009,2008,2007,2005,2004,2003,2001,2000
This statistics in other country:
Timeline:
This timeline shows a graph from 2000 to 2012 of Bangladesh. No data until 1999. Number of actual observations by date: 11.
Source name:
World Development Indicators
Source organization:
United Nations Educational, Scientific, and Cultural Organization (UNESCO) Institute for Statistics.
Categories, topics:
Education
Last updated:
apr 23, 2017
Indicators value changes by year
Maximum:
12.904
jan 1, 2011
At the date of observation
Value
Absolute change
Change from previous value
jan 1, 2000
10.276
+10.276
0.0%
jan 1, 2001
9.564
-0.712
-6.93%
jan 1, 2003
10.71
+1.147
11.99%
jan 1, 2004
11.597
+0.887
8.28%
jan 1, 2005
12.587
+0.99
8.54%
jan 1, 2007
12.904
+0.316
2.51%
jan 1, 2008
12.454
-0.45
-3.48%
jan 1, 2009
11.881
-0.574
-4.61%
jan 1, 2010
10.599
-1.282
-10.79%
jan 1, 2011
12.904
+2.305
21.75%
jan 1, 2012
12.17
-0.734
-5.69%
Ranking of countries by current statistics by years


Comments: