29
/
en
AIzaSyAYiBZKx7MnpbEhh9jyipgxe19OcubqV5w
April 1, 2024
169946
Korea, Rep.
KOR
true
2
1
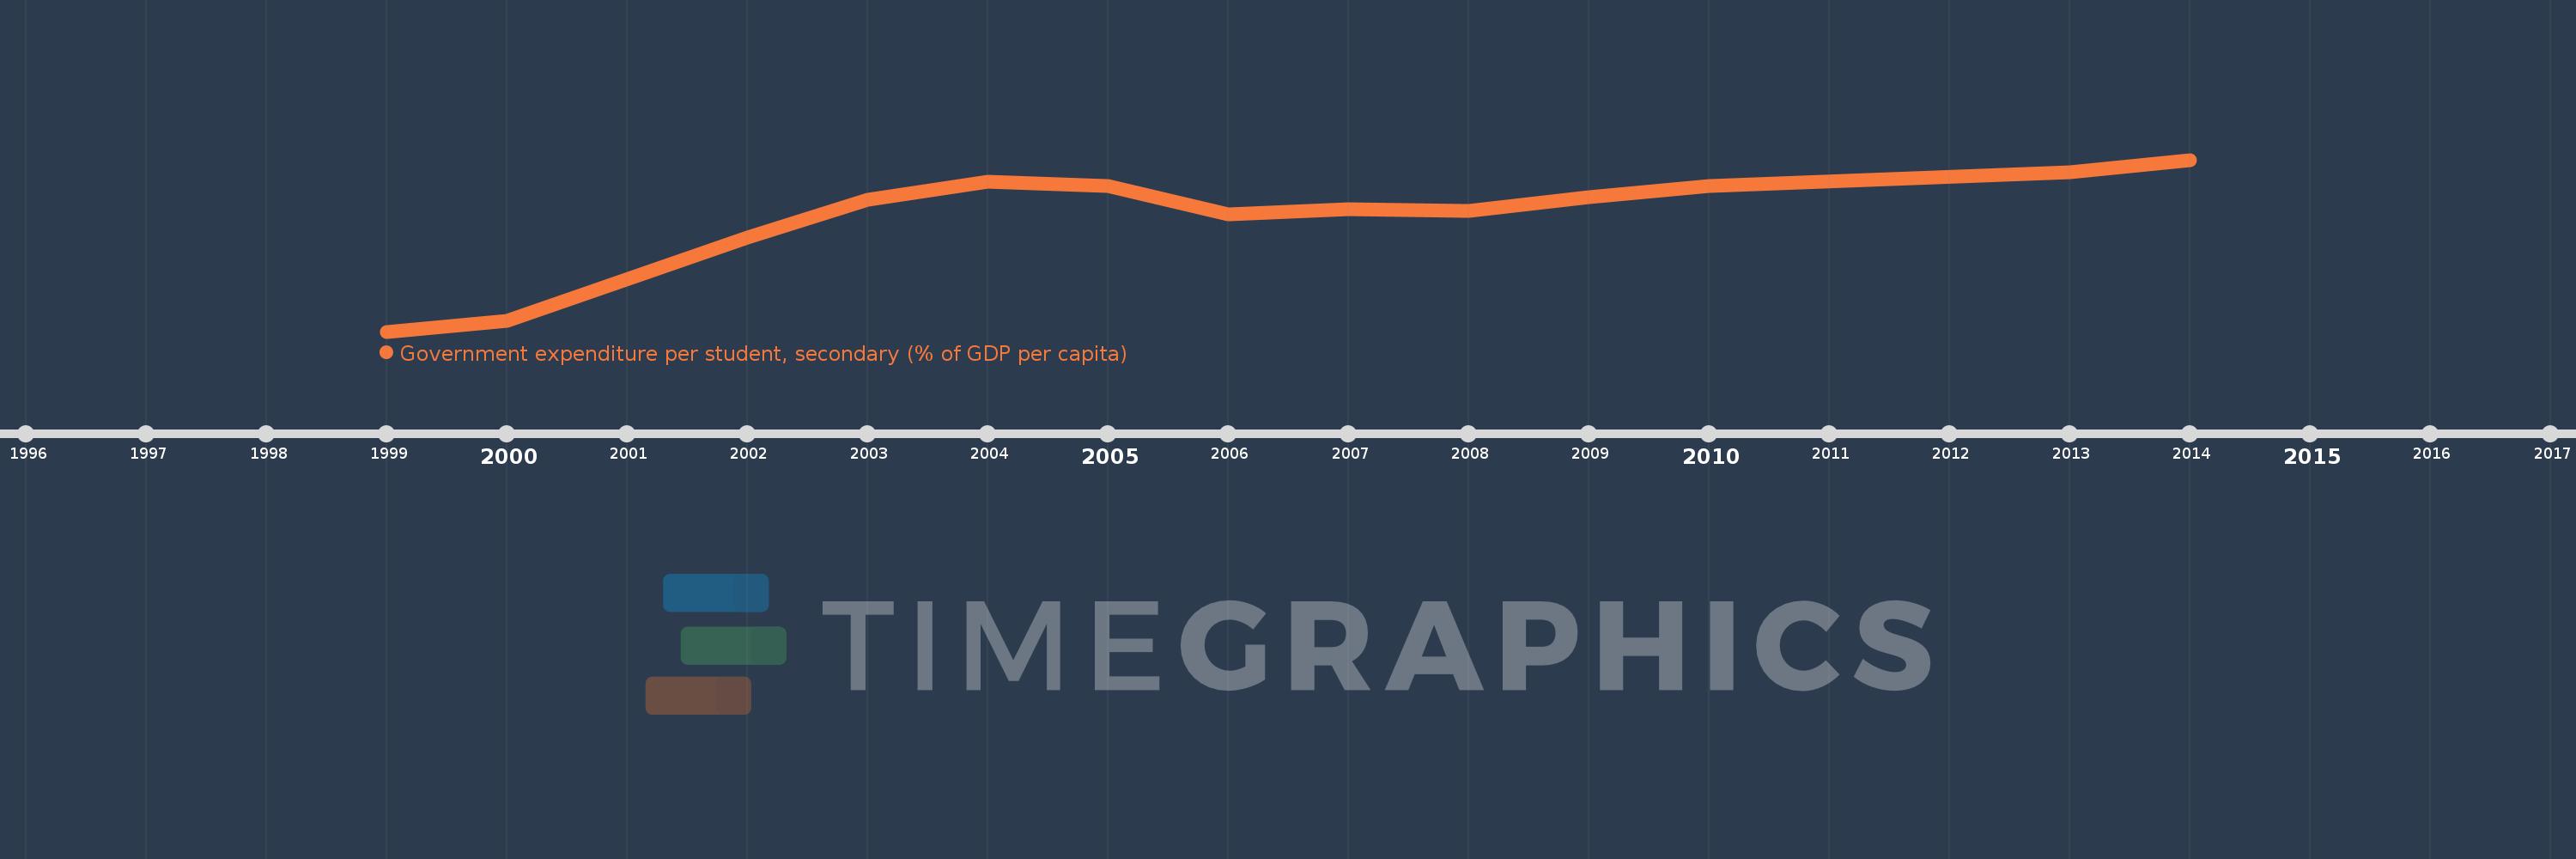
Government expenditure per student, secondary (% of GDP per capita)
2014,2013,2010,2009,2008,2007,2006,2005,2004,2003,2002,2000,1999
This statistics in other country:
Timeline:
This timeline shows a graph from 1999 to 2014 of Korea, Rep.. No data until 1998. Number of actual observations by date: 13.
Source name:
World Development Indicators
Source organization:
United Nations Educational, Scientific, and Cultural Organization (UNESCO) Institute for Statistics.
Categories, topics:
Education
Last updated:
apr 23, 2017
Indicators value changes by year
Minimum:
13.714
jan 1, 1999
Maximum:
23.761
jan 1, 2014
At the date of observation
Value
Absolute change
Change from previous value
jan 1, 1999
13.714
+13.714
0.0%
jan 1, 2000
14.341
+0.627
4.57%
jan 1, 2002
19.193
+4.851
33.83%
jan 1, 2003
21.409
+2.217
11.55%
jan 1, 2004
22.466
+1.057
4.94%
jan 1, 2005
22.211
-0.255
-1.13%
jan 1, 2006
20.589
-1.622
-7.3%
jan 1, 2007
20.879
+0.29
1.41%
jan 1, 2008
20.769
-0.111
-0.53%
jan 1, 2009
21.581
+0.812
3.91%
jan 1, 2010
22.22
+0.639
2.96%
jan 1, 2013
23.02
+0.799
3.6%
jan 1, 2014
23.761
+0.742
3.22%
Ranking of countries by current statistics by years


Comments: