29
/
en
AIzaSyAYiBZKx7MnpbEhh9jyipgxe19OcubqV5w
April 1, 2024
151612
Hong Kong SAR, China
HKG
true
2
1
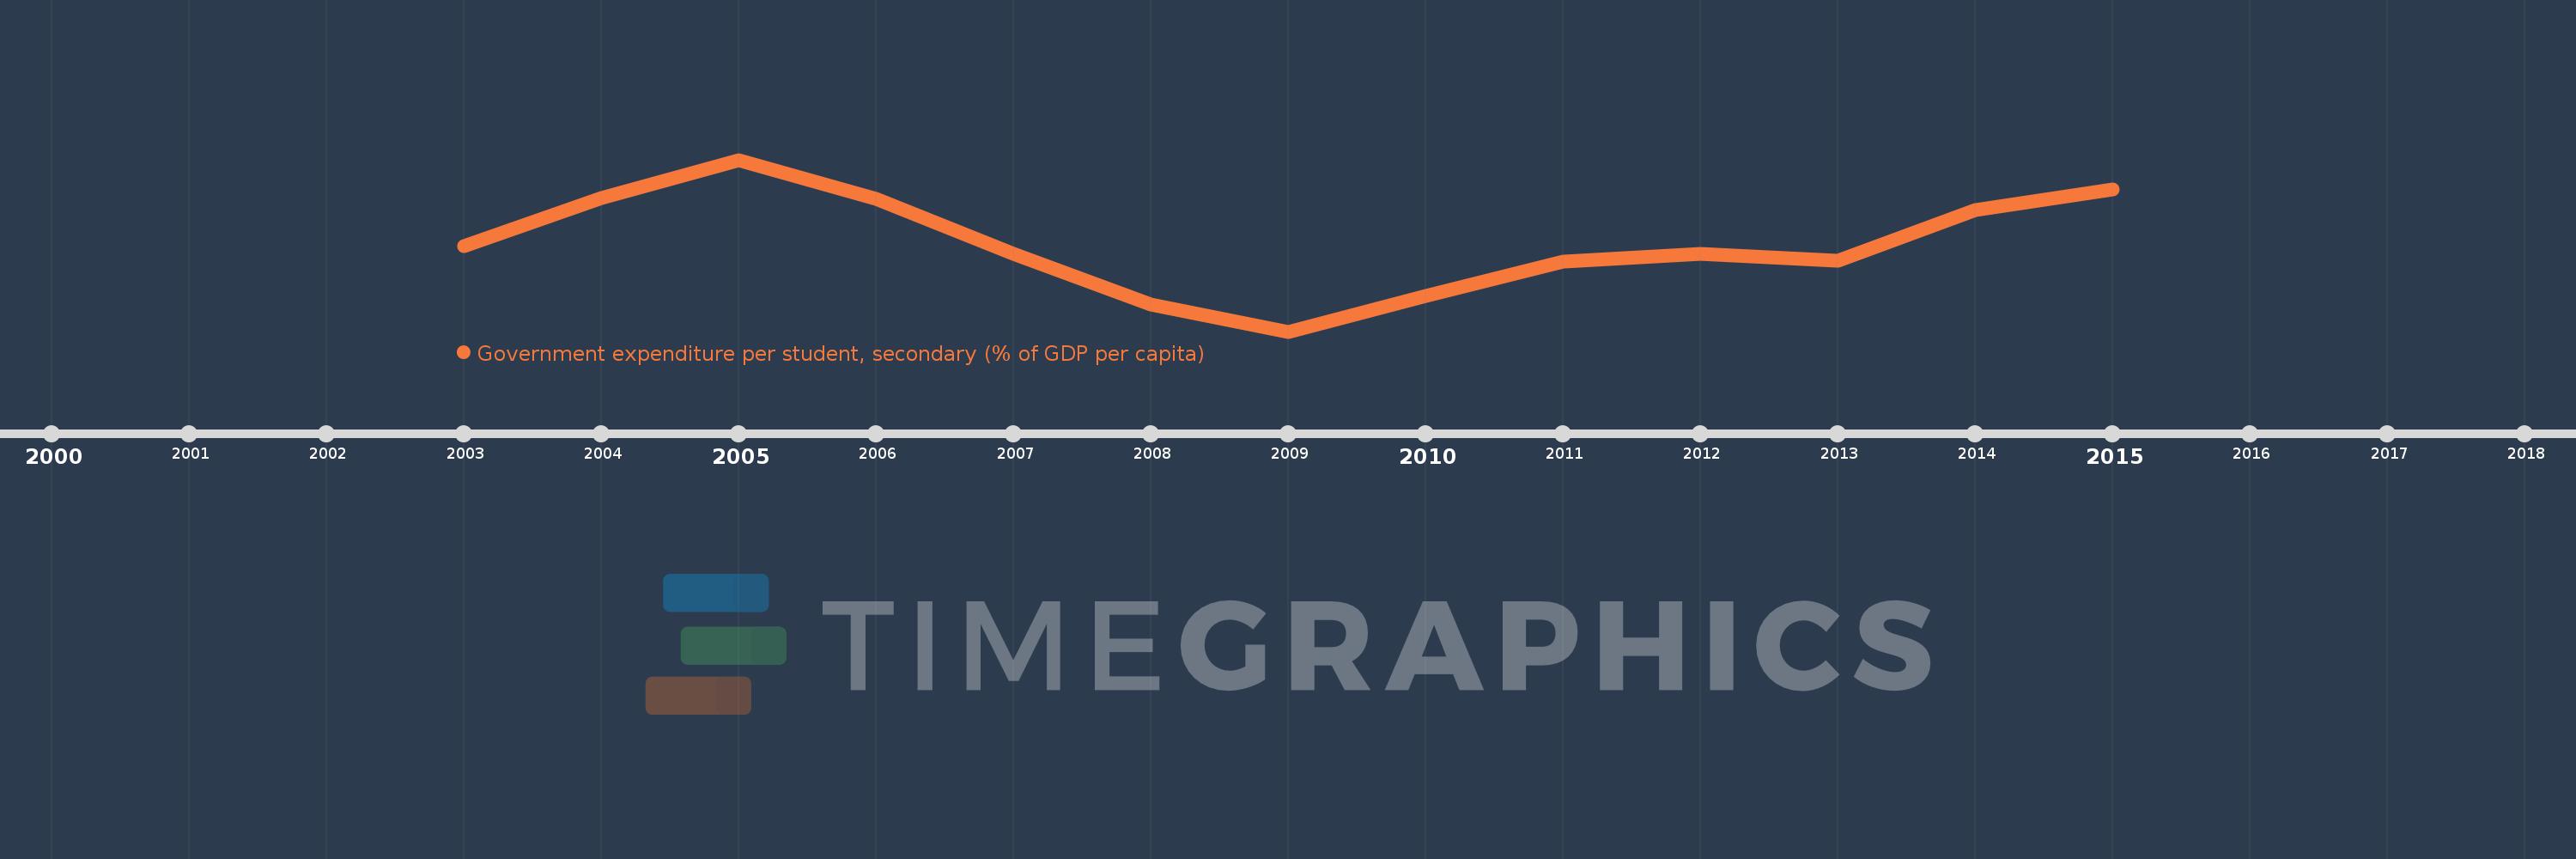
Government expenditure per student, secondary (% of GDP per capita)
2015,2014,2013,2012,2011,2010,2009,2008,2007,2006,2005,2004,2003
This statistics in other country:
Timeline:
This timeline shows a graph from 2003 to 2015 of Hong Kong SAR, China. No data until 2002. Number of actual observations by date: 13.
Source name:
World Development Indicators
Source organization:
United Nations Educational, Scientific, and Cultural Organization (UNESCO) Institute for Statistics.
Categories, topics:
Education
Last updated:
apr 23, 2017
Indicators value changes by year
Minimum:
14.948
jan 1, 2009
Maximum:
20.233
jan 1, 2005
At the date of observation
Value
Absolute change
Change from previous value
jan 1, 2003
17.577
+17.577
0.0%
jan 1, 2004
19.07
+1.493
8.49%
jan 1, 2005
20.233
+1.163
6.1%
jan 1, 2006
19.031
-1.201
-5.94%
jan 1, 2007
17.333
-1.698
-8.92%
jan 1, 2008
15.793
-1.54
-8.89%
jan 1, 2009
14.948
-0.845
-5.35%
jan 1, 2010
16.047
+1.1
7.36%
jan 1, 2011
17.112
+1.065
6.64%
jan 1, 2012
17.334
+0.222
1.3%
jan 1, 2013
17.115
-0.22
-1.27%
jan 1, 2014
18.68
+1.566
9.15%
jan 1, 2015
19.326
+0.646
3.46%
Ranking of countries by current statistics by years


Comments: