30
/
AIzaSyAYiBZKx7MnpbEhh9jyipgxe19OcubqV5w
April 1, 2024
96705
Burundi
BDI
true
2
1
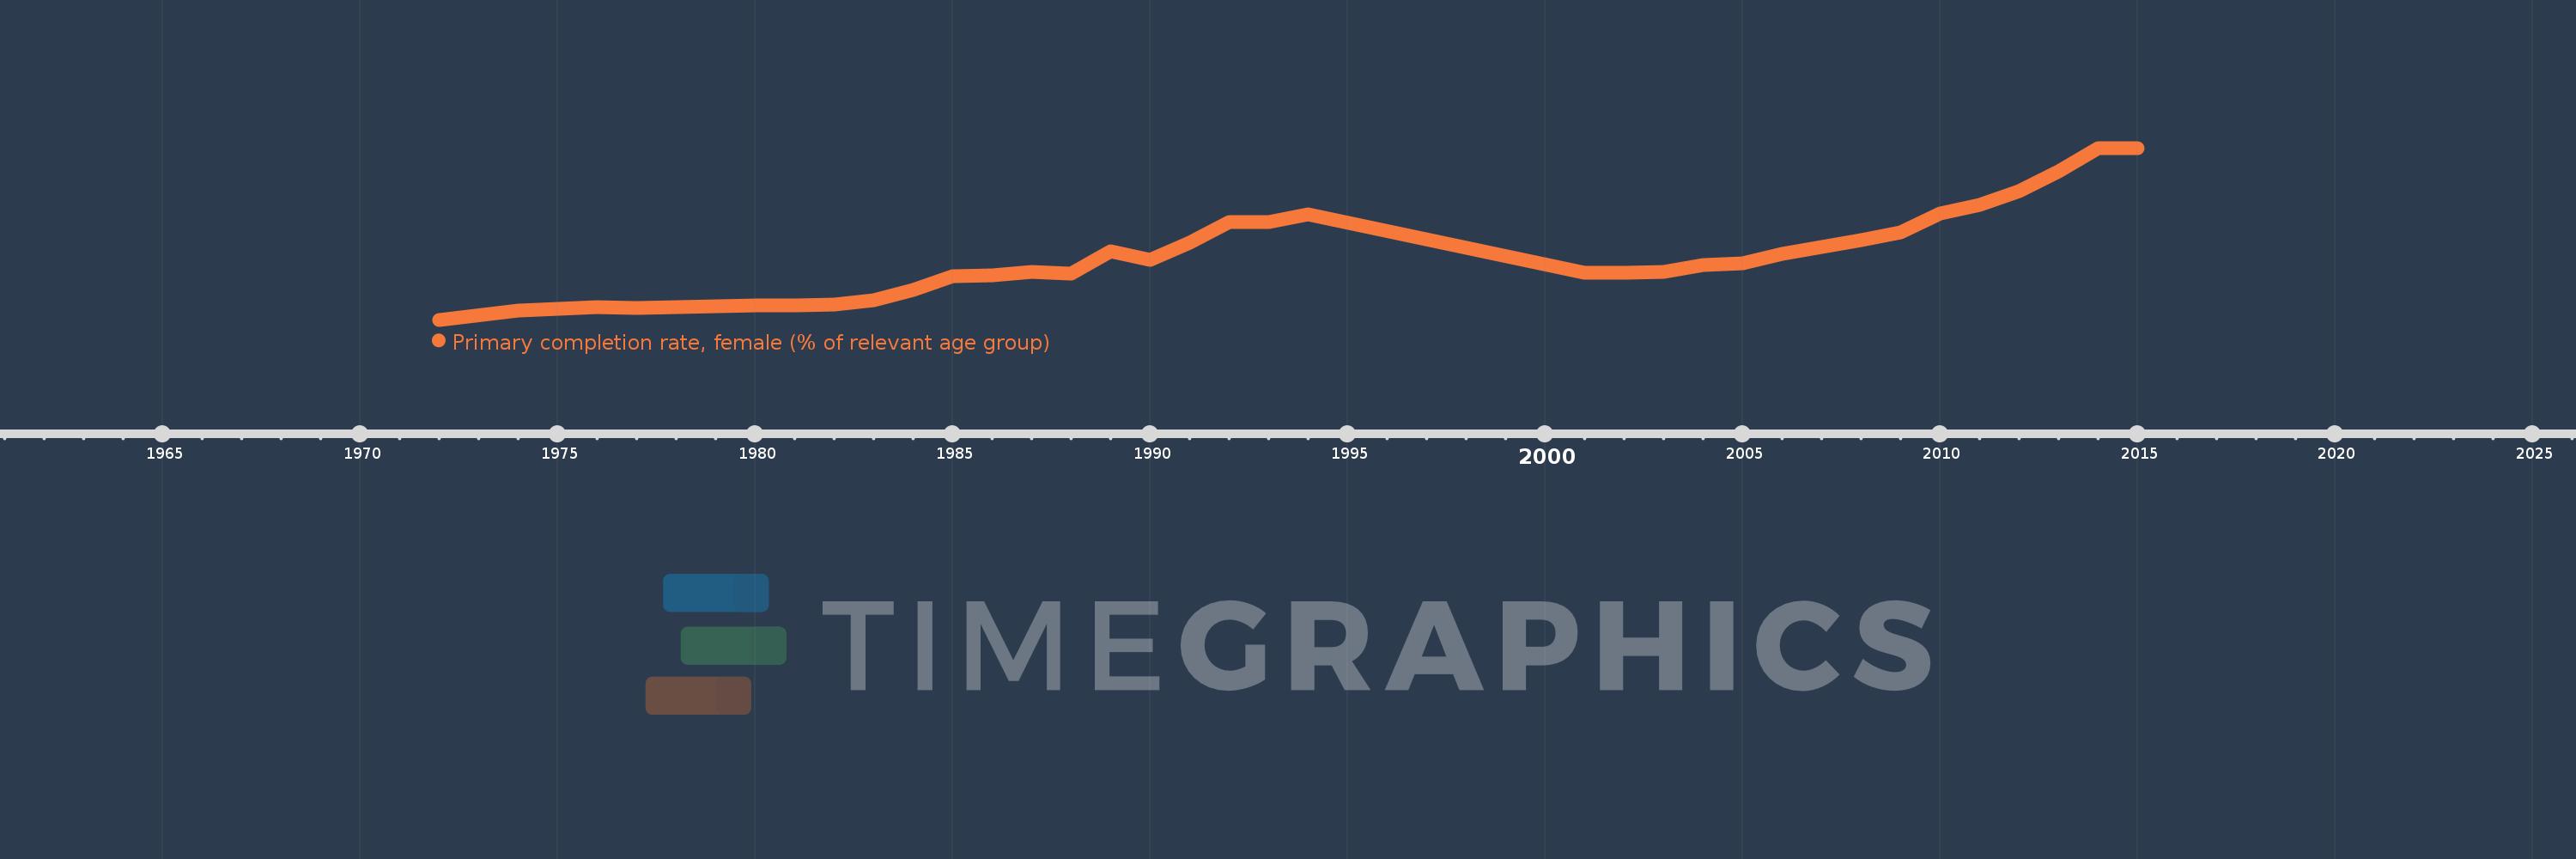
Primary completion rate, female (% of relevant age group)
2015,2014,2013,2012,2011,2010,2009,2008,2006,2005,2004,2003,2002,2001,1994,1993,1992,1991,1990,1989,1988,1987,1986,1985,1984,1983,1982,1981,1980,1979,1978,1977,1976,1975,1974,1972
