30
/
AIzaSyAYiBZKx7MnpbEhh9jyipgxe19OcubqV5w
April 1, 2024
142242
Greece
GRC
true
2
1
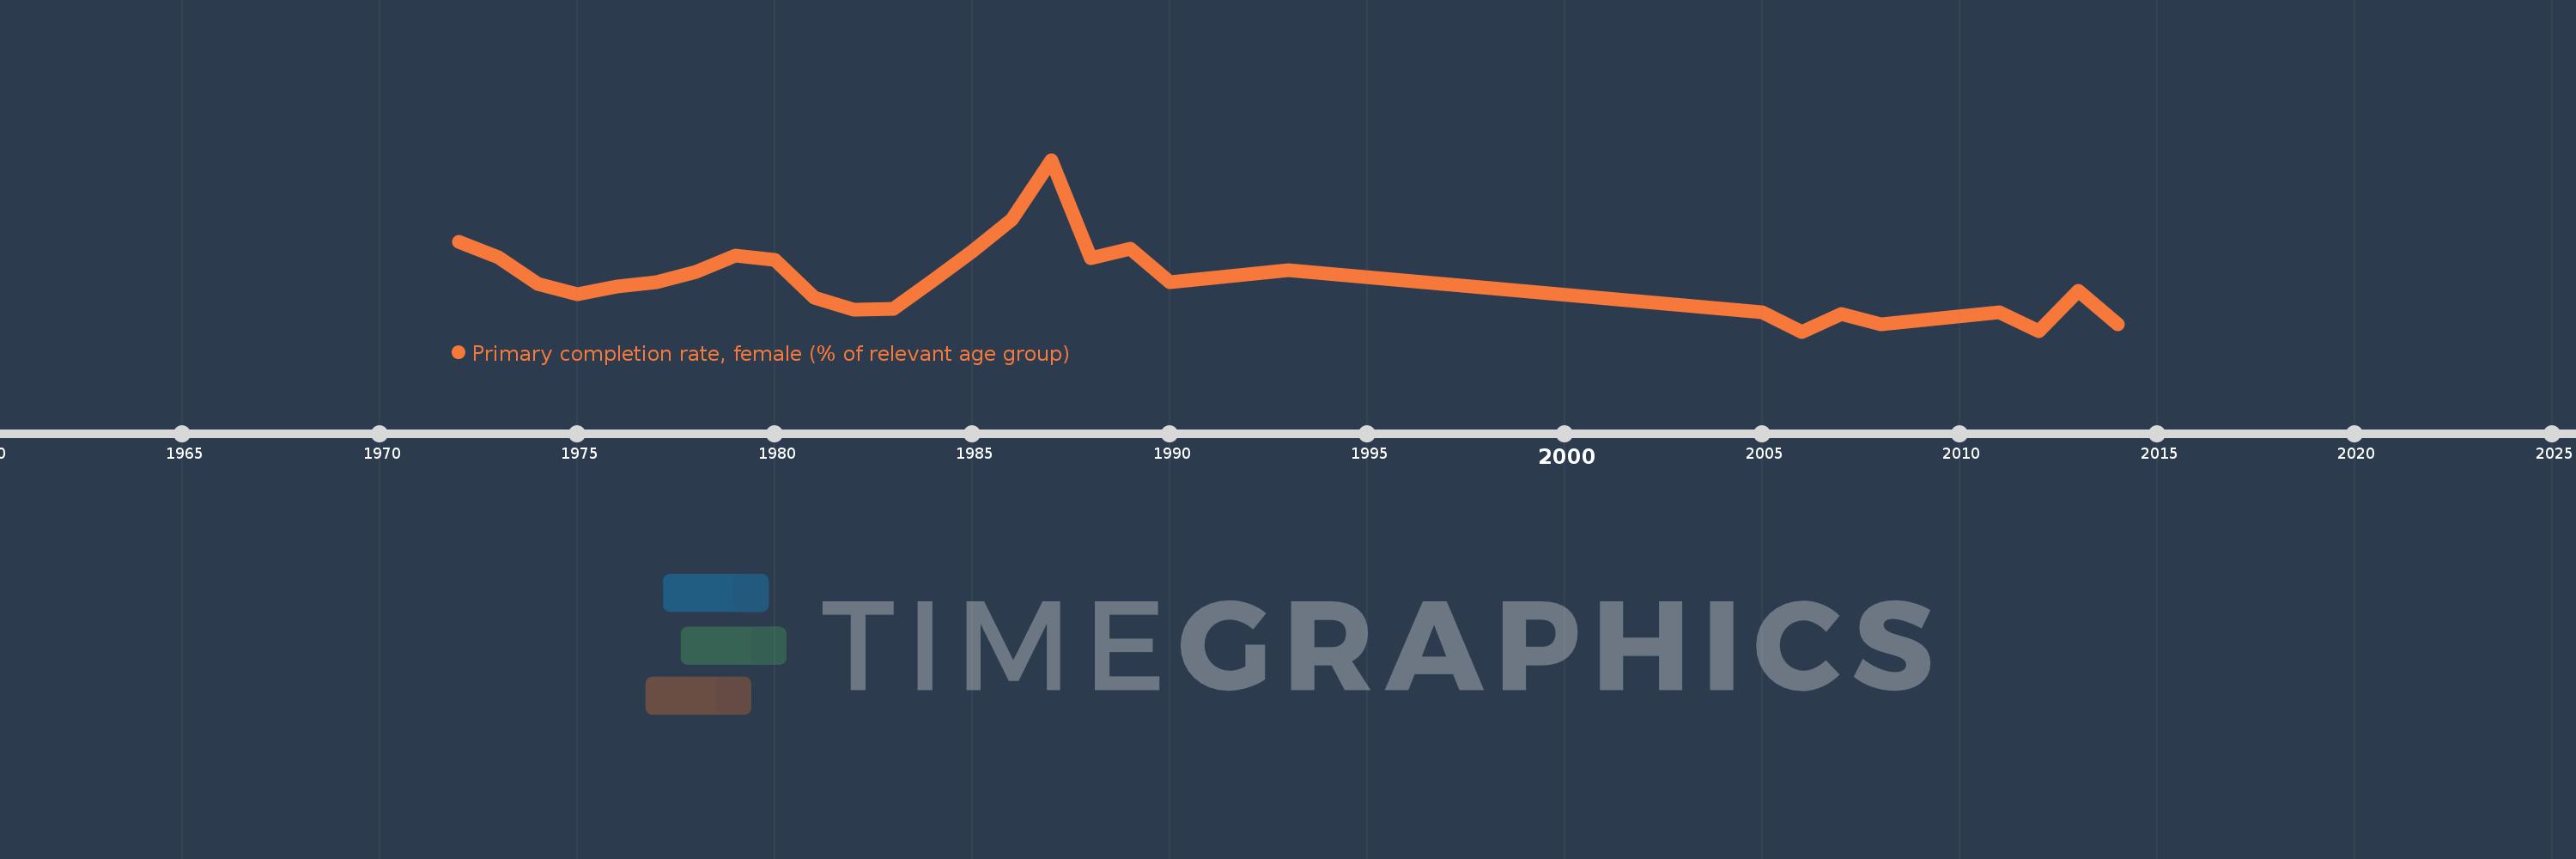
Primary completion rate, female (% of relevant age group)
2014,2013,2012,2011,2008,2007,2006,2005,1993,1990,1989,1988,1987,1986,1985,1984,1983,1982,1981,1980,1979,1978,1977,1976,1975,1974,1973,1972
