29
/
en
AIzaSyAYiBZKx7MnpbEhh9jyipgxe19OcubqV5w
April 1, 2024
47640
Lower middle income
LMC
false
2
1
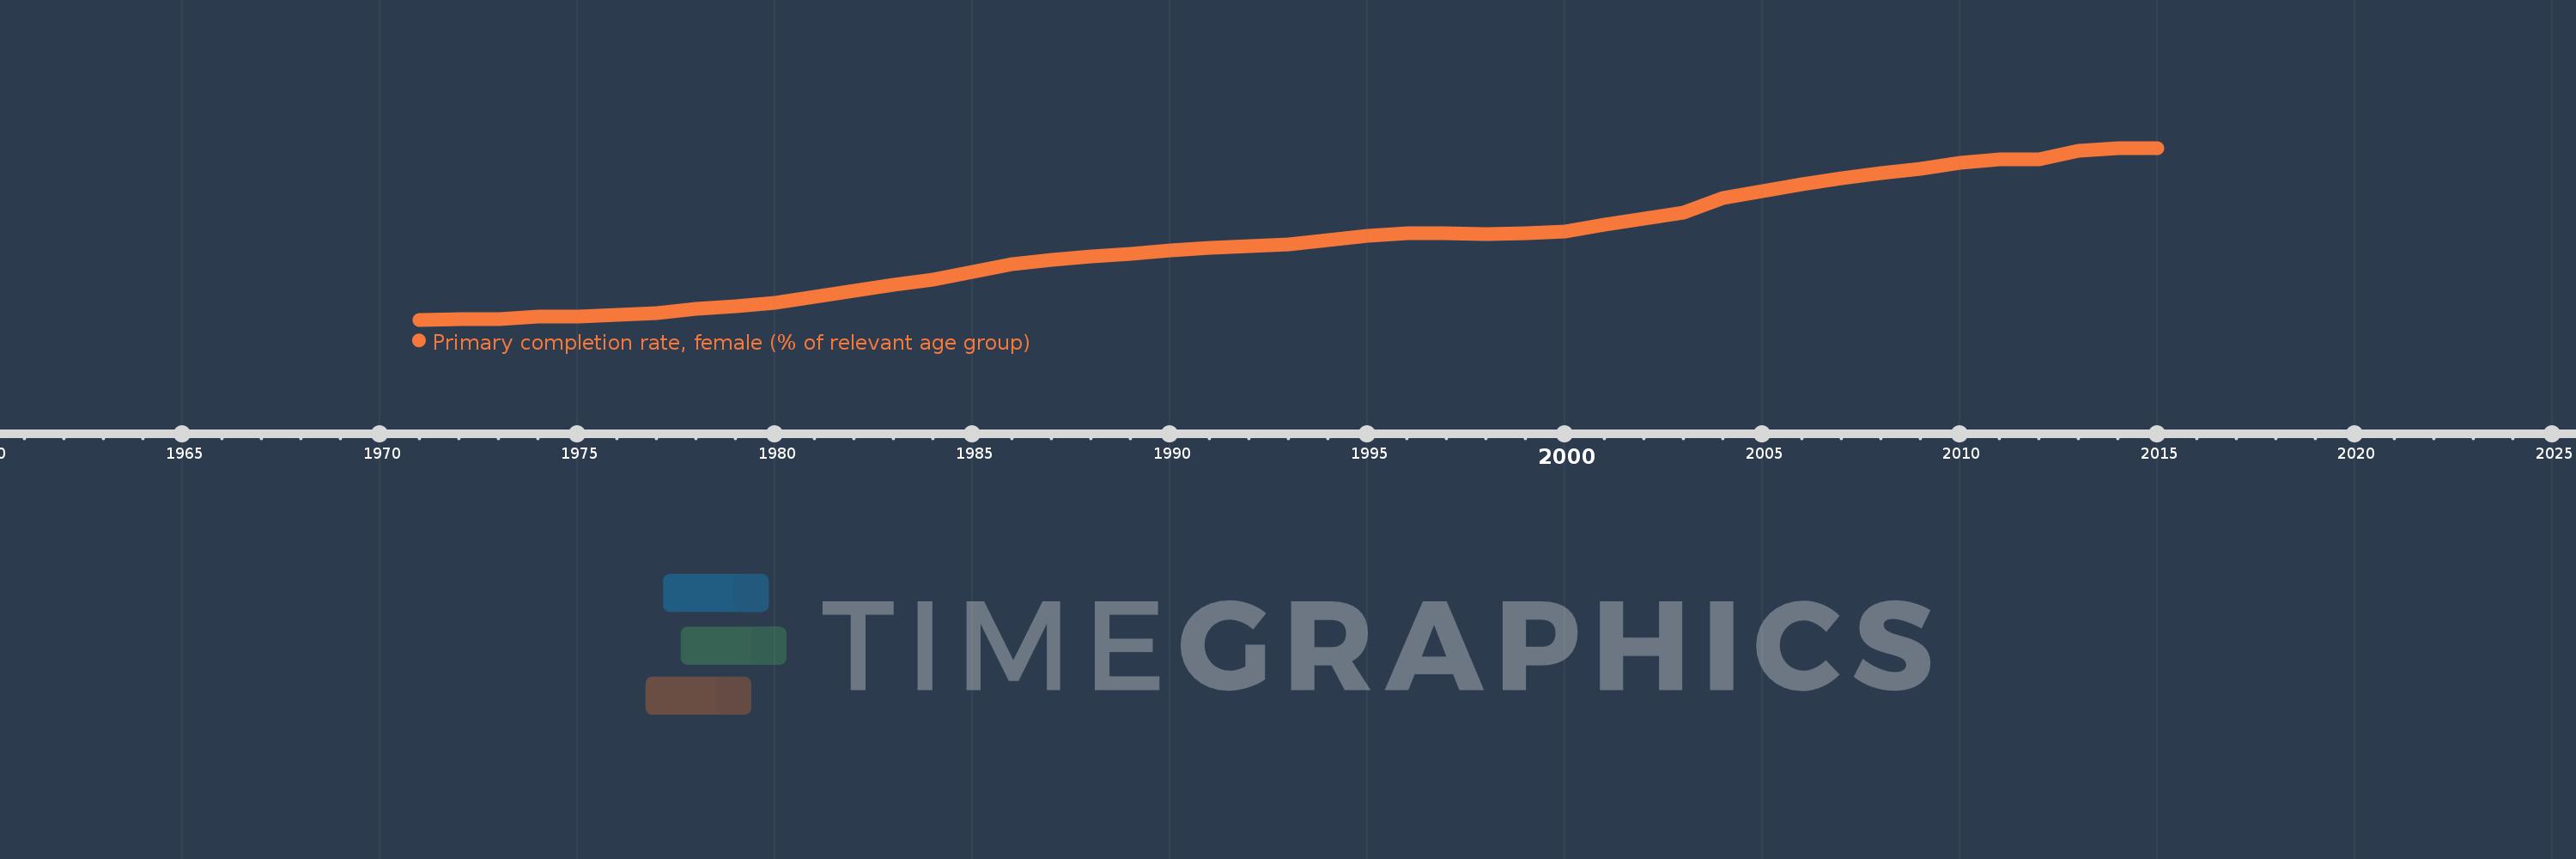
Primary completion rate, female (% of relevant age group)
2015,2014,2013,2012,2011,2010,2009,2008,2007,2006,2005,2004,2003,2002,2001,2000,1999,1998,1997,1996,1995,1994,1993,1992,1991,1990,1989,1988,1987,1986,1985,1984,1983,1982,1981,1980,1979,1978,1977,1976,1975,1974,1973,1972,1971
This statistics in other country:
AfghanistanAlbaniaAlgeriaAngolaAntigua and BarbudaArab WorldArgentinaArmeniaArubaAustriaAzerbaijanBahamas, TheBahrainBangladeshBarbadosBelarusBelgiumBelizeBeninBermudaBhutanBoliviaBosnia and HerzegovinaBotswanaBrunei DarussalamBulgariaBurkina FasoBurundiCabo VerdeCambodiaCameroonCanadaCaribbean small statesCentral African RepublicCentral Europe and the BalticsChadChileChinaColombiaComorosCongo, Dem. Rep.Congo, Rep.Costa RicaCote d'IvoireCroatiaCubaCyprusCzech RepublicDenmarkDjiboutiDominicaDominican RepublicEarly-demographic dividendEast Asia & PacificEast Asia & Pacific (excluding high income)East Asia & Pacific (IDA & IBRD countries)EcuadorEgypt, Arab Rep.El SalvadorEquatorial GuineaEritreaEstoniaEthiopiaEuro areaEurope & Central AsiaEurope & Central Asia (excluding high income)Europe & Central Asia (IDA & IBRD countries)European UnionFijiFinlandFragile and conflict affected situationsFranceGabonGambia, TheGeorgiaGermanyGhanaGreeceGrenadaGuatemalaGuineaGuinea-BissauGuyanaHaitiHeavily indebted poor countries (HIPC)High incomeHondurasHong Kong SAR, ChinaHungaryIBRD onlyIcelandIDA & IBRD totalIDA blendIDA onlyIDA totalIndiaIndonesiaIran, Islamic Rep.IraqIrelandIsraelItalyJamaicaJapanJordanKazakhstanKenyaKiribatiKorea, Dem. People’s Rep.Korea, Rep.KuwaitKyrgyz RepublicLao PDRLate-demographic dividendLatin America & Caribbean Latin America & Caribbean (excluding high income)Latin America & the Caribbean (IDA & IBRD countries)LatviaLeast developed countries: UN classificationLebanonLesothoLiberiaLibyaLiechtensteinLithuaniaLow & middle incomeLow incomeLower middle incomeLuxembourgMacao SAR, ChinaMacedonia, FYRMadagascarMalawiMaldivesMaliMaltaMarshall IslandsMauritaniaMauritiusMexicoMiddle East & North AfricaMiddle East & North Africa (excluding high income)Middle East & North Africa (IDA & IBRD countries)Middle incomeMoldovaMongoliaMontenegroMoroccoMozambiqueMyanmarNamibiaNauruNepalNetherlandsNew ZealandNicaraguaNigerNigeriaNorwayOECD membersOmanOther small statesPacific island small statesPakistanPalauPanamaPapua New GuineaParaguayPeruPhilippinesPolandPortugalPost-demographic dividendPre-demographic dividendQatarRomaniaRussian FederationRwandaSamoaSan MarinoSao Tome and PrincipeSaudi ArabiaSenegalSerbiaSeychellesSierra LeoneSlovak RepublicSloveniaSmall statesSolomon IslandsSouth AfricaSouth AsiaSouth Asia (IDA & IBRD)South SudanSpainSri LankaSt. Kitts and NevisSt. LuciaSt. Vincent and the GrenadinesSub-Saharan Africa Sub-Saharan Africa (excluding high income)Sub-Saharan Africa (IDA & IBRD countries)SudanSurinameSwazilandSwedenSwitzerlandSyrian Arab RepublicTajikistanTanzaniaThailandTimor-LesteTogoTongaTrinidad and TobagoTunisiaTurkeyTuvaluUgandaUkraineUnited Arab EmiratesUpper middle incomeUruguayUzbekistanVanuatuVenezuela, RBVietnamWest Bank and GazaWorldYemen, Rep.ZambiaZimbabwe Timeline:
This timeline shows a graph from 1971 to 2015 of Lower middle income. No data until 1970. Number of actual observations by date: 45.
Source name:
World Development Indicators
Source organization:
United Nations Educational, Scientific, and Cultural Organization (UNESCO) Institute for Statistics.
Categories, topics:
Education, Gender
Last updated:
apr 23, 2017
Indicators value changes by year
Minimum:
43.253
jan 1, 1971
Maximum:
91.336
jan 1, 2015
At the date of observation
Value
Absolute change
Change from previous value
jan 1, 1971
43.253
+43.253
0.0%
jan 1, 1972
43.369
+0.116
0.27%
jan 1, 1973
43.477
+0.109
0.25%
jan 1, 1974
44.083
+0.605
1.39%
jan 1, 1975
44.08
-0.002
-0.01%
jan 1, 1976
44.715
+0.635
1.44%
jan 1, 1977
45.183
+0.468
1.05%
jan 1, 1978
46.192
+1.01
2.23%
jan 1, 1979
47.124
+0.932
2.02%
jan 1, 1980
48.055
+0.931
1.98%
jan 1, 1981
49.715
+1.66
3.45%
jan 1, 1982
51.296
+1.581
3.18%
jan 1, 1983
52.989
+1.693
3.3%
jan 1, 1984
54.58
+1.59
3.0%
jan 1, 1985
56.645
+2.065
3.78%
jan 1, 1986
58.715
+2.071
3.66%
jan 1, 1987
60.004
+1.289
2.19%
jan 1, 1988
60.906
+0.902
1.5%
jan 1, 1989
61.732
+0.826
1.36%
jan 1, 1990
62.643
+0.911
1.48%
jan 1, 1991
63.392
+0.749
1.2%
jan 1, 1992
63.868
+0.476
0.75%
jan 1, 1993
64.4
+0.533
0.83%
jan 1, 1994
65.629
+1.228
1.91%
jan 1, 1995
66.682
+1.053
1.6%
jan 1, 1996
67.553
+0.871
1.31%
jan 1, 1997
67.428
-0.125
-0.18%
jan 1, 1998
67.246
-0.182
-0.27%
jan 1, 1999
67.534
+0.289
0.43%
jan 1, 2000
67.868
+0.334
0.49%
jan 1, 2001
69.824
+1.956
2.88%
jan 1, 2002
71.555
+1.731
2.48%
jan 1, 2003
73.257
+1.702
2.38%
jan 1, 2004
77.335
+4.078
5.57%
jan 1, 2005
79.139
+1.805
2.33%
jan 1, 2006
81.149
+2.01
2.54%
jan 1, 2007
82.904
+1.755
2.16%
jan 1, 2008
84.353
+1.449
1.75%
jan 1, 2009
85.614
+1.261
1.49%
jan 1, 2010
87.29
+1.676
1.96%
jan 1, 2011
88.207
+0.918
1.05%
jan 1, 2012
88.071
-0.136
-0.15%
jan 1, 2013
90.442
+2.37
2.69%
jan 1, 2014
91.292
+0.851
0.94%
jan 1, 2015
91.336
+0.044
0.05%
Ranking of countries by current statistics by years


Comments: