29
/
en
AIzaSyAYiBZKx7MnpbEhh9jyipgxe19OcubqV5w
April 1, 2024
212297
Niger
NER
true
2
1
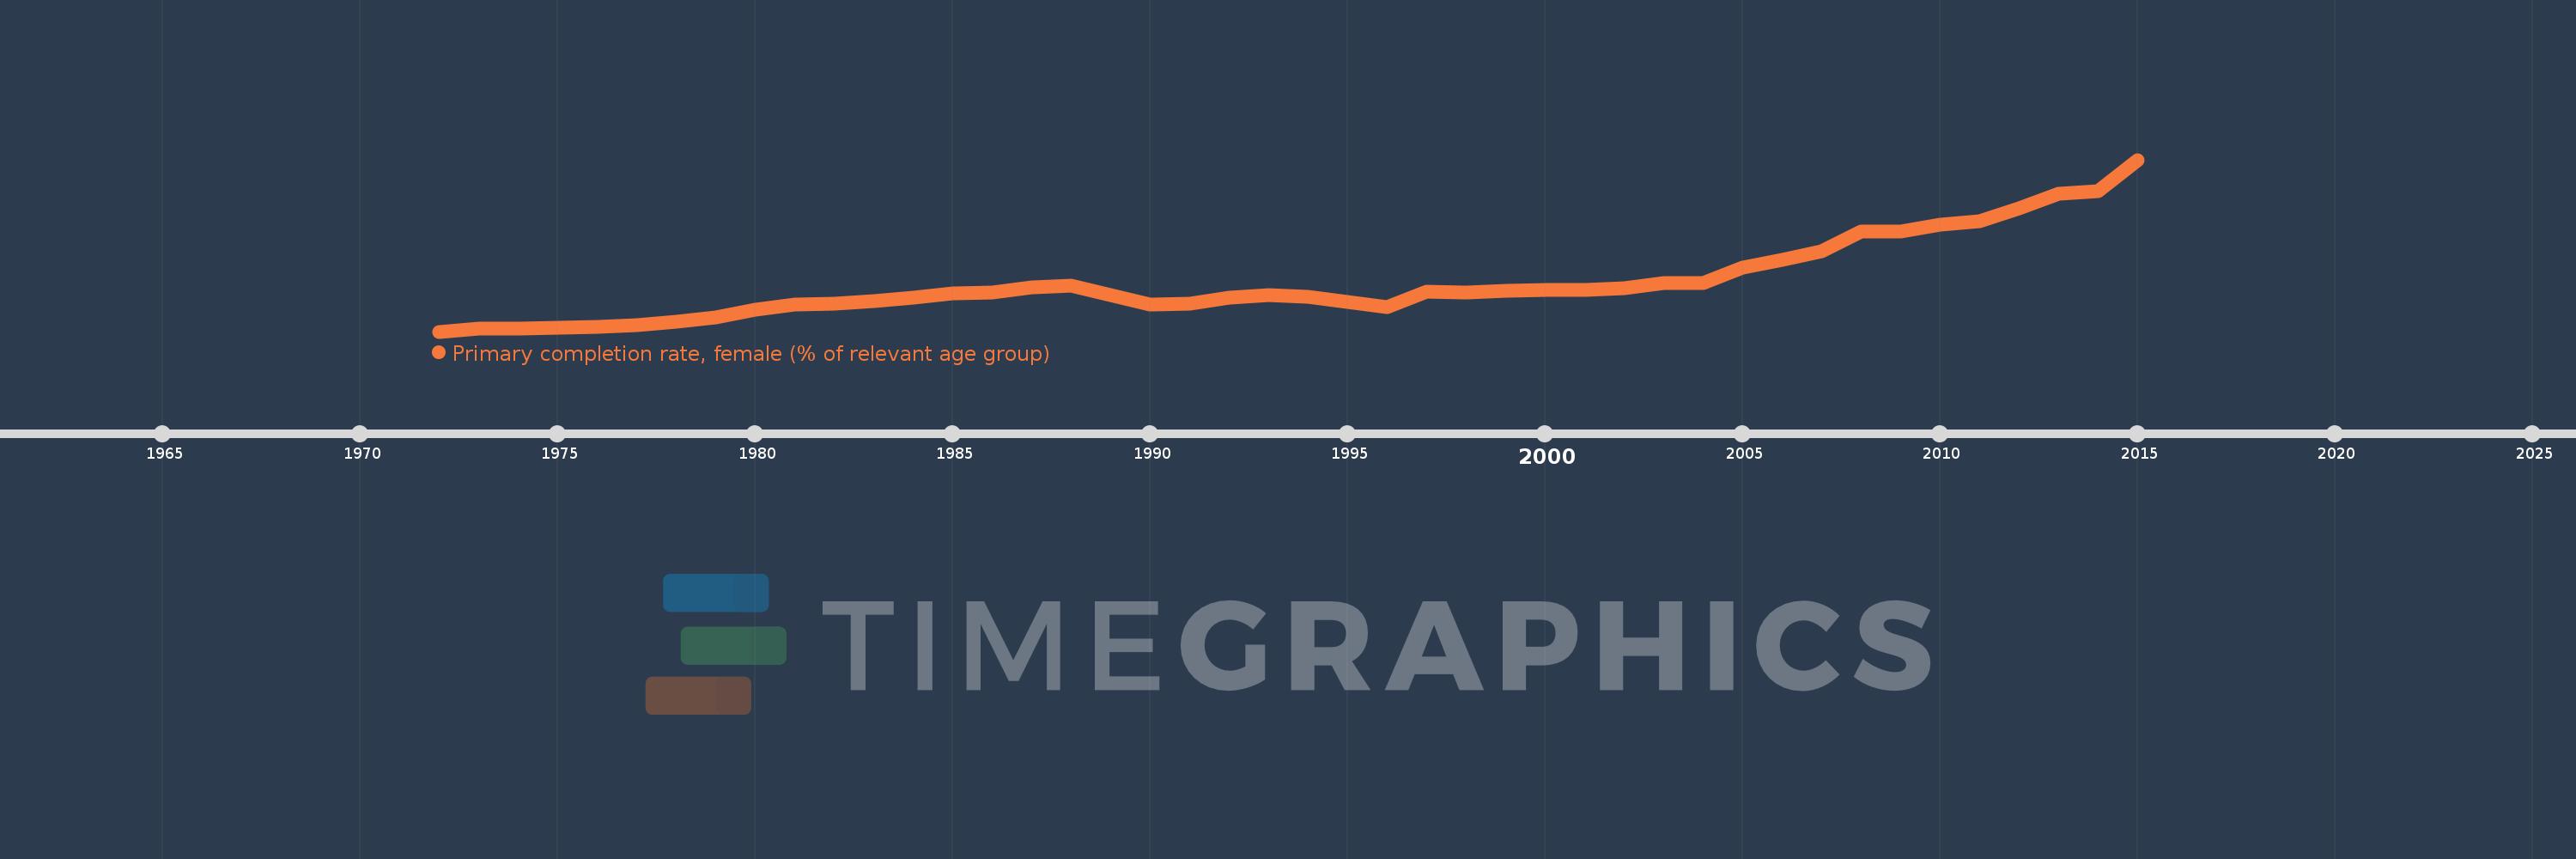
Primary completion rate, female (% of relevant age group)
2015,2014,2013,2012,2011,2010,2009,2008,2007,2006,2005,2004,2003,2002,2001,2000,1999,1998,1997,1996,1994,1993,1992,1991,1990,1988,1987,1986,1985,1984,1983,1982,1981,1980,1979,1978,1977,1976,1975,1974,1973,1972
This statistics in other country:
AfghanistanAlbaniaAlgeriaAngolaAntigua and BarbudaArab WorldArgentinaArmeniaArubaAustriaAzerbaijanBahamas, TheBahrainBangladeshBarbadosBelarusBelgiumBelizeBeninBermudaBhutanBoliviaBosnia and HerzegovinaBotswanaBrunei DarussalamBulgariaBurkina FasoBurundiCabo VerdeCambodiaCameroonCanadaCaribbean small statesCentral African RepublicCentral Europe and the BalticsChadChileChinaColombiaComorosCongo, Dem. Rep.Congo, Rep.Costa RicaCote d'IvoireCroatiaCubaCyprusCzech RepublicDenmarkDjiboutiDominicaDominican RepublicEarly-demographic dividendEast Asia & PacificEast Asia & Pacific (excluding high income)East Asia & Pacific (IDA & IBRD countries)EcuadorEgypt, Arab Rep.El SalvadorEquatorial GuineaEritreaEstoniaEthiopiaEuro areaEurope & Central AsiaEurope & Central Asia (excluding high income)Europe & Central Asia (IDA & IBRD countries)European UnionFijiFinlandFragile and conflict affected situationsFranceGabonGambia, TheGeorgiaGermanyGhanaGreeceGrenadaGuatemalaGuineaGuinea-BissauGuyanaHaitiHeavily indebted poor countries (HIPC)High incomeHondurasHong Kong SAR, ChinaHungaryIBRD onlyIcelandIDA & IBRD totalIDA blendIDA onlyIDA totalIndiaIndonesiaIran, Islamic Rep.IraqIrelandIsraelItalyJamaicaJapanJordanKazakhstanKenyaKiribatiKorea, Dem. People’s Rep.Korea, Rep.KuwaitKyrgyz RepublicLao PDRLate-demographic dividendLatin America & Caribbean Latin America & Caribbean (excluding high income)Latin America & the Caribbean (IDA & IBRD countries)LatviaLeast developed countries: UN classificationLebanonLesothoLiberiaLibyaLiechtensteinLithuaniaLow & middle incomeLow incomeLower middle incomeLuxembourgMacao SAR, ChinaMacedonia, FYRMadagascarMalawiMaldivesMaliMaltaMarshall IslandsMauritaniaMauritiusMexicoMiddle East & North AfricaMiddle East & North Africa (excluding high income)Middle East & North Africa (IDA & IBRD countries)Middle incomeMoldovaMongoliaMontenegroMoroccoMozambiqueMyanmarNamibiaNauruNepalNetherlandsNew ZealandNicaraguaNigerNigeriaNorwayOECD membersOmanOther small statesPacific island small statesPakistanPalauPanamaPapua New GuineaParaguayPeruPhilippinesPolandPortugalPost-demographic dividendPre-demographic dividendQatarRomaniaRussian FederationRwandaSamoaSan MarinoSao Tome and PrincipeSaudi ArabiaSenegalSerbiaSeychellesSierra LeoneSlovak RepublicSloveniaSmall statesSolomon IslandsSouth AfricaSouth AsiaSouth Asia (IDA & IBRD)South SudanSpainSri LankaSt. Kitts and NevisSt. LuciaSt. Vincent and the GrenadinesSub-Saharan Africa Sub-Saharan Africa (excluding high income)Sub-Saharan Africa (IDA & IBRD countries)SudanSurinameSwazilandSwedenSwitzerlandSyrian Arab RepublicTajikistanTanzaniaThailandTimor-LesteTogoTongaTrinidad and TobagoTunisiaTurkeyTuvaluUgandaUkraineUnited Arab EmiratesUpper middle incomeUruguayUzbekistanVanuatuVenezuela, RBVietnamWest Bank and GazaWorldYemen, Rep.ZambiaZimbabwe Timeline:
This timeline shows a graph from 1972 to 2015 of Niger. No data until 1971. Number of actual observations by date: 42.
Source name:
World Development Indicators
Source organization:
United Nations Educational, Scientific, and Cultural Organization (UNESCO) Institute for Statistics.
Categories, topics:
Education, Gender
Last updated:
apr 23, 2017
Indicators value changes by year
Maximum:
51.717
jan 1, 2015
At the date of observation
Value
Absolute change
Change from previous value
jan 1, 1972
3.294
+3.294
0.0%
jan 1, 1973
4.139
+0.845
25.66%
jan 1, 1974
4.246
+0.107
2.58%
jan 1, 1975
4.416
+0.171
4.02%
jan 1, 1976
4.679
+0.263
5.96%
jan 1, 1977
5.146
+0.467
9.97%
jan 1, 1978
5.981
+0.835
16.23%
jan 1, 1979
7.211
+1.229
20.55%
jan 1, 1980
9.588
+2.377
32.96%
jan 1, 1981
10.92
+1.332
13.89%
jan 1, 1982
11.222
+0.302
2.77%
jan 1, 1983
11.864
+0.642
5.72%
jan 1, 1984
12.836
+0.973
8.2%
jan 1, 1985
14.06
+1.224
9.54%
jan 1, 1986
14.237
+0.177
1.26%
jan 1, 1987
15.678
+1.441
10.12%
jan 1, 1988
16.317
+0.639
4.08%
jan 1, 1990
10.837
-5.48
-33.59%
jan 1, 1991
11.102
+0.265
2.44%
jan 1, 1992
12.956
+1.854
16.7%
jan 1, 1993
13.558
+0.602
4.65%
jan 1, 1994
13.103
-0.456
-3.36%
jan 1, 1996
10.257
-2.846
-21.72%
jan 1, 1997
14.496
+4.239
41.33%
jan 1, 1998
14.193
-0.303
-2.09%
jan 1, 1999
14.89
+0.697
4.91%
jan 1, 2000
15.115
+0.225
1.51%
jan 1, 2001
14.993
-0.122
-0.8%
jan 1, 2002
15.51
+0.517
3.45%
jan 1, 2003
17.092
+1.582
10.2%
jan 1, 2004
17.012
-0.08
-0.47%
jan 1, 2005
21.303
+4.291
25.22%
jan 1, 2006
23.397
+2.094
9.83%
jan 1, 2007
25.916
+2.519
10.77%
jan 1, 2008
31.425
+5.509
21.26%
jan 1, 2009
31.432
+0.007
0.02%
jan 1, 2010
33.331
+1.899
6.04%
jan 1, 2011
34.457
+1.126
3.38%
jan 1, 2012
38.101
+3.644
10.58%
jan 1, 2013
42.183
+4.082
10.71%
jan 1, 2014
42.971
+0.788
1.87%
jan 1, 2015
51.717
+8.746
20.35%
Ranking of countries by current statistics by years


Comments: