29
/
en
AIzaSyAYiBZKx7MnpbEhh9jyipgxe19OcubqV5w
April 1, 2024
41846
Latin America & Caribbean
LCN
false
2
1
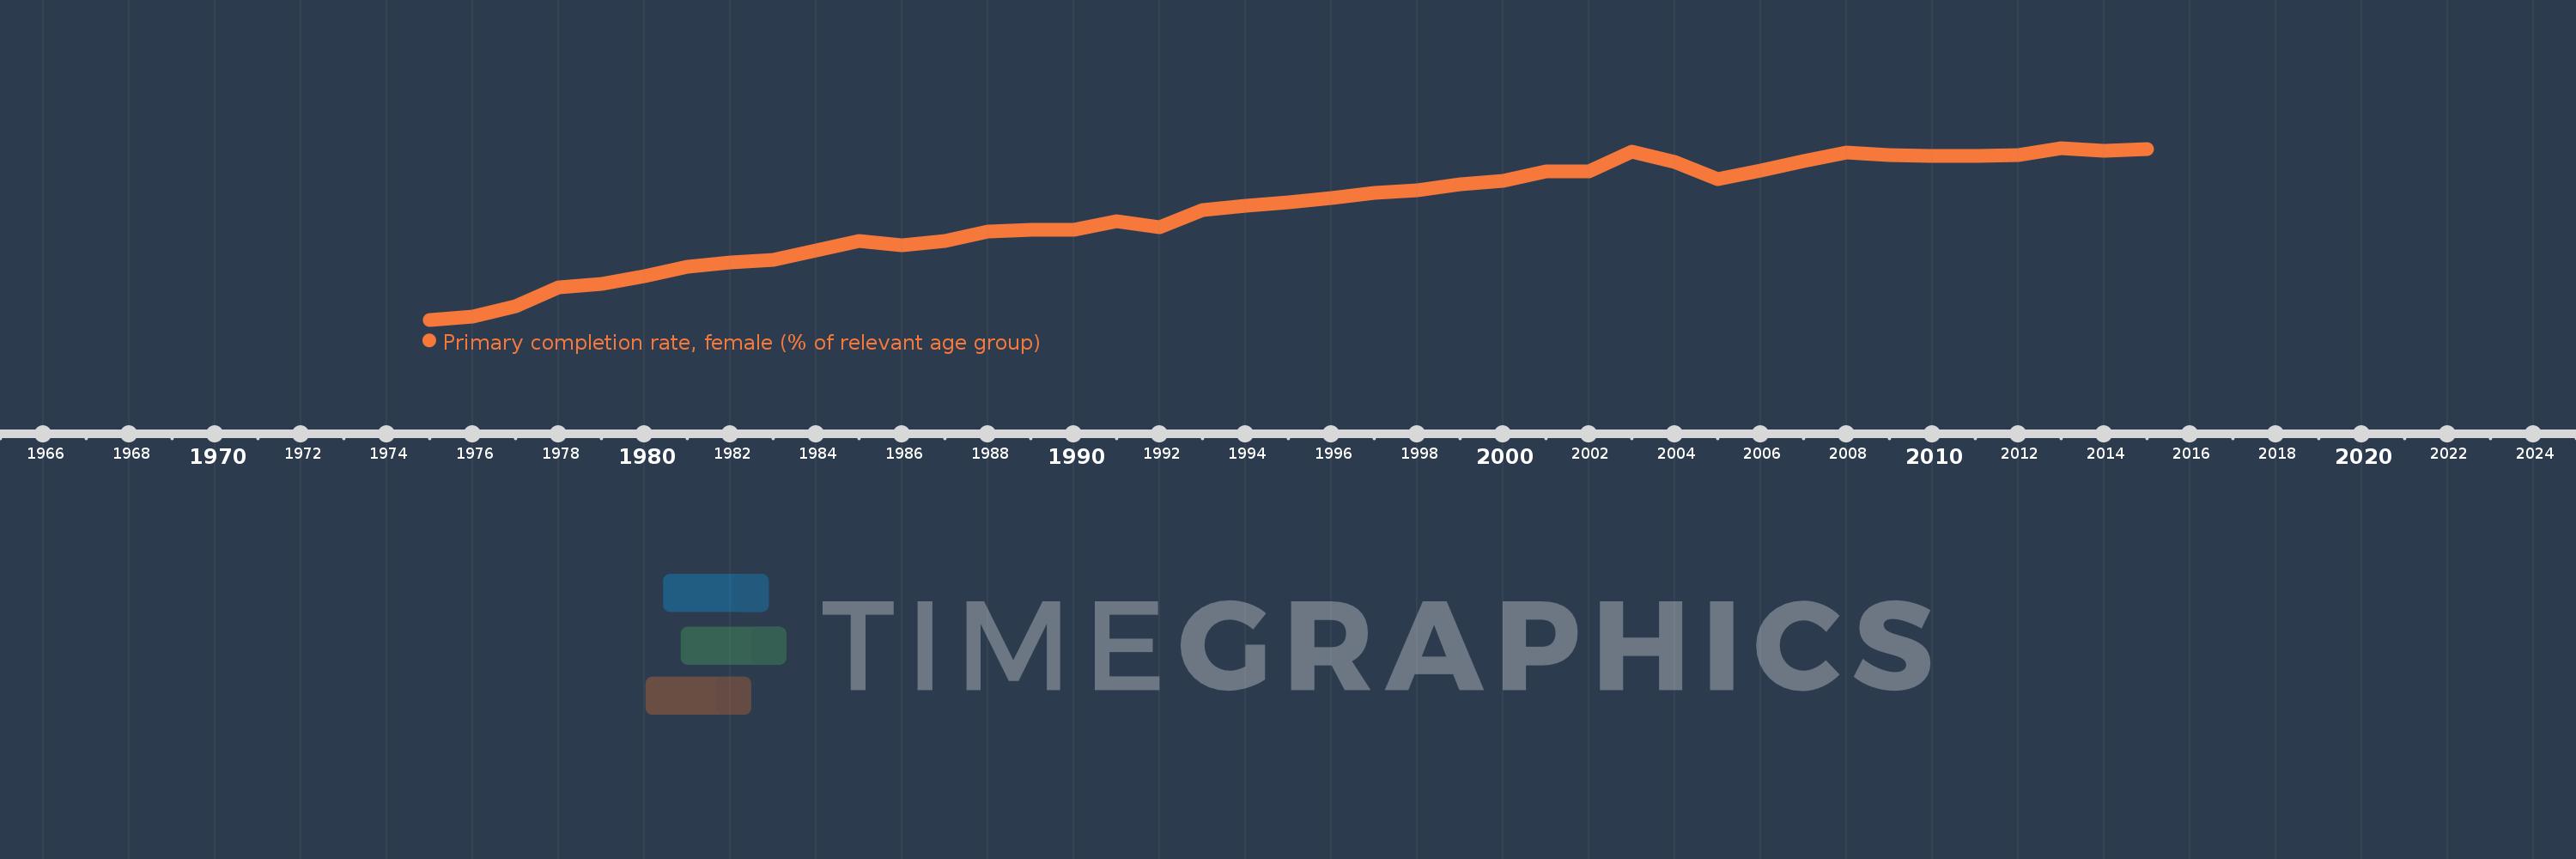
Primary completion rate, female (% of relevant age group)
2015,2014,2013,2012,2011,2010,2009,2008,2007,2006,2005,2004,2003,2002,2001,2000,1999,1998,1997,1996,1995,1994,1993,1992,1991,1990,1989,1988,1987,1986,1985,1984,1983,1982,1981,1980,1979,1978,1977,1976,1975
This statistics in other country:
AfghanistanAlbaniaAlgeriaAngolaAntigua and BarbudaArab WorldArgentinaArmeniaArubaAustriaAzerbaijanBahamas, TheBahrainBangladeshBarbadosBelarusBelgiumBelizeBeninBermudaBhutanBoliviaBosnia and HerzegovinaBotswanaBrunei DarussalamBulgariaBurkina FasoBurundiCabo VerdeCambodiaCameroonCanadaCaribbean small statesCentral African RepublicCentral Europe and the BalticsChadChileChinaColombiaComorosCongo, Dem. Rep.Congo, Rep.Costa RicaCote d'IvoireCroatiaCubaCyprusCzech RepublicDenmarkDjiboutiDominicaDominican RepublicEarly-demographic dividendEast Asia & PacificEast Asia & Pacific (excluding high income)East Asia & Pacific (IDA & IBRD countries)EcuadorEgypt, Arab Rep.El SalvadorEquatorial GuineaEritreaEstoniaEthiopiaEuro areaEurope & Central AsiaEurope & Central Asia (excluding high income)Europe & Central Asia (IDA & IBRD countries)European UnionFijiFinlandFragile and conflict affected situationsFranceGabonGambia, TheGeorgiaGermanyGhanaGreeceGrenadaGuatemalaGuineaGuinea-BissauGuyanaHaitiHeavily indebted poor countries (HIPC)High incomeHondurasHong Kong SAR, ChinaHungaryIBRD onlyIcelandIDA & IBRD totalIDA blendIDA onlyIDA totalIndiaIndonesiaIran, Islamic Rep.IraqIrelandIsraelItalyJamaicaJapanJordanKazakhstanKenyaKiribatiKorea, Dem. People’s Rep.Korea, Rep.KuwaitKyrgyz RepublicLao PDRLate-demographic dividendLatin America & Caribbean Latin America & Caribbean (excluding high income)Latin America & the Caribbean (IDA & IBRD countries)LatviaLeast developed countries: UN classificationLebanonLesothoLiberiaLibyaLiechtensteinLithuaniaLow & middle incomeLow incomeLower middle incomeLuxembourgMacao SAR, ChinaMacedonia, FYRMadagascarMalawiMaldivesMaliMaltaMarshall IslandsMauritaniaMauritiusMexicoMiddle East & North AfricaMiddle East & North Africa (excluding high income)Middle East & North Africa (IDA & IBRD countries)Middle incomeMoldovaMongoliaMontenegroMoroccoMozambiqueMyanmarNamibiaNauruNepalNetherlandsNew ZealandNicaraguaNigerNigeriaNorwayOECD membersOmanOther small statesPacific island small statesPakistanPalauPanamaPapua New GuineaParaguayPeruPhilippinesPolandPortugalPost-demographic dividendPre-demographic dividendQatarRomaniaRussian FederationRwandaSamoaSan MarinoSao Tome and PrincipeSaudi ArabiaSenegalSerbiaSeychellesSierra LeoneSlovak RepublicSloveniaSmall statesSolomon IslandsSouth AfricaSouth AsiaSouth Asia (IDA & IBRD)South SudanSpainSri LankaSt. Kitts and NevisSt. LuciaSt. Vincent and the GrenadinesSub-Saharan Africa Sub-Saharan Africa (excluding high income)Sub-Saharan Africa (IDA & IBRD countries)SudanSurinameSwazilandSwedenSwitzerlandSyrian Arab RepublicTajikistanTanzaniaThailandTimor-LesteTogoTongaTrinidad and TobagoTunisiaTurkeyTuvaluUgandaUkraineUnited Arab EmiratesUpper middle incomeUruguayUzbekistanVanuatuVenezuela, RBVietnamWest Bank and GazaWorldYemen, Rep.ZambiaZimbabwe Timeline:
This timeline shows a graph from 1975 to 2015 of Latin America & Caribbean . No data until 1974. Number of actual observations by date: 41.
Source name:
World Development Indicators
Source organization:
United Nations Educational, Scientific, and Cultural Organization (UNESCO) Institute for Statistics.
Categories, topics:
Education, Gender
Last updated:
apr 23, 2017
Indicators value changes by year
Minimum:
82.202
jan 1, 1975
Maximum:
100.429
jan 1, 2013
At the date of observation
Value
Absolute change
Change from previous value
jan 1, 1975
82.202
+82.202
0.0%
jan 1, 1976
82.581
+0.378
0.46%
jan 1, 1977
83.597
+1.017
1.23%
jan 1, 1978
85.642
+2.045
2.45%
jan 1, 1979
86.03
+0.387
0.45%
jan 1, 1980
86.798
+0.768
0.89%
jan 1, 1981
87.812
+1.014
1.17%
jan 1, 1982
88.254
+0.442
0.5%
jan 1, 1983
88.587
+0.333
0.38%
jan 1, 1984
89.597
+1.01
1.14%
jan 1, 1985
90.56
+0.963
1.08%
jan 1, 1986
90.143
-0.418
-0.46%
jan 1, 1987
90.554
+0.411
0.46%
jan 1, 1988
91.525
+0.971
1.07%
jan 1, 1989
91.736
+0.211
0.23%
jan 1, 1990
91.757
+0.021
0.02%
jan 1, 1991
92.648
+0.891
0.97%
jan 1, 1992
92.057
-0.592
-0.64%
jan 1, 1993
93.86
+1.803
1.96%
jan 1, 1994
94.284
+0.423
0.45%
jan 1, 1995
94.701
+0.417
0.44%
jan 1, 1996
95.134
+0.433
0.46%
jan 1, 1997
95.645
+0.512
0.54%
jan 1, 1998
95.963
+0.317
0.33%
jan 1, 1999
96.591
+0.628
0.65%
jan 1, 2000
96.968
+0.376
0.39%
jan 1, 2001
97.948
+0.98
1.01%
jan 1, 2002
97.966
+0.018
0.02%
jan 1, 2003
100.054
+2.088
2.13%
jan 1, 2004
98.981
-1.072
-1.07%
jan 1, 2005
97.132
-1.849
-1.87%
jan 1, 2006
98.035
+0.903
0.93%
jan 1, 2007
99.052
+1.017
1.04%
jan 1, 2008
99.951
+0.899
0.91%
jan 1, 2009
99.671
-0.28
-0.28%
jan 1, 2010
99.599
-0.072
-0.07%
jan 1, 2011
99.548
-0.051
-0.05%
jan 1, 2012
99.681
+0.133
0.13%
jan 1, 2013
100.429
+0.748
0.75%
jan 1, 2014
100.09
-0.339
-0.34%
jan 1, 2015
100.28
+0.191
0.19%
Ranking of countries by current statistics by years


Comments: