29
/
en
AIzaSyAYiBZKx7MnpbEhh9jyipgxe19OcubqV5w
April 1, 2024
261518
Tanzania
TZA
true
2
1
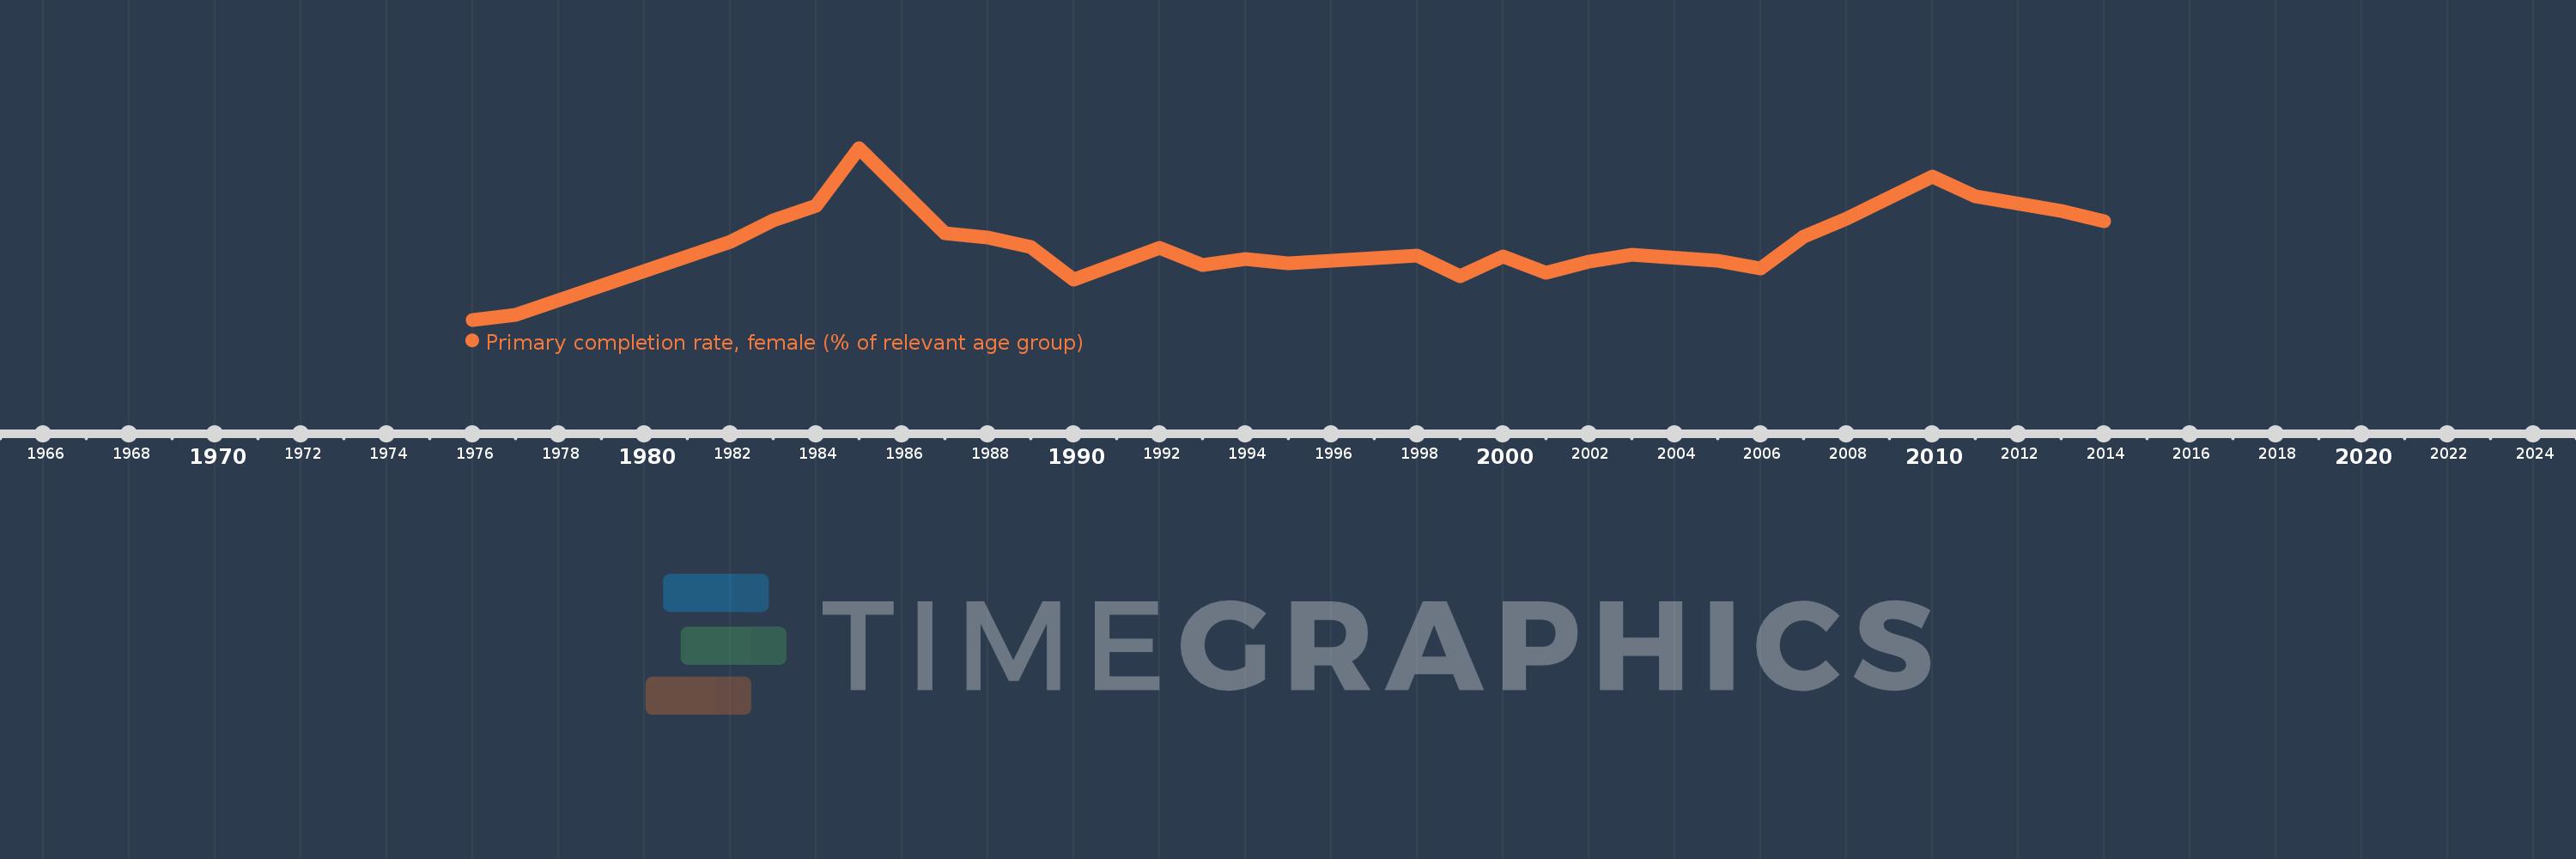
Primary completion rate, female (% of relevant age group)
2014,2013,2011,2010,2008,2007,2006,2005,2003,2002,2001,2000,1999,1998,1995,1994,1993,1992,1990,1989,1988,1987,1985,1984,1983,1982,1977,1976
This statistics in other country:
AfghanistanAlbaniaAlgeriaAngolaAntigua and BarbudaArab WorldArgentinaArmeniaArubaAustriaAzerbaijanBahamas, TheBahrainBangladeshBarbadosBelarusBelgiumBelizeBeninBermudaBhutanBoliviaBosnia and HerzegovinaBotswanaBrunei DarussalamBulgariaBurkina FasoBurundiCabo VerdeCambodiaCameroonCanadaCaribbean small statesCentral African RepublicCentral Europe and the BalticsChadChileChinaColombiaComorosCongo, Dem. Rep.Congo, Rep.Costa RicaCote d'IvoireCroatiaCubaCyprusCzech RepublicDenmarkDjiboutiDominicaDominican RepublicEarly-demographic dividendEast Asia & PacificEast Asia & Pacific (excluding high income)East Asia & Pacific (IDA & IBRD countries)EcuadorEgypt, Arab Rep.El SalvadorEquatorial GuineaEritreaEstoniaEthiopiaEuro areaEurope & Central AsiaEurope & Central Asia (excluding high income)Europe & Central Asia (IDA & IBRD countries)European UnionFijiFinlandFragile and conflict affected situationsFranceGabonGambia, TheGeorgiaGermanyGhanaGreeceGrenadaGuatemalaGuineaGuinea-BissauGuyanaHaitiHeavily indebted poor countries (HIPC)High incomeHondurasHong Kong SAR, ChinaHungaryIBRD onlyIcelandIDA & IBRD totalIDA blendIDA onlyIDA totalIndiaIndonesiaIran, Islamic Rep.IraqIrelandIsraelItalyJamaicaJapanJordanKazakhstanKenyaKiribatiKorea, Dem. People’s Rep.Korea, Rep.KuwaitKyrgyz RepublicLao PDRLate-demographic dividendLatin America & Caribbean Latin America & Caribbean (excluding high income)Latin America & the Caribbean (IDA & IBRD countries)LatviaLeast developed countries: UN classificationLebanonLesothoLiberiaLibyaLiechtensteinLithuaniaLow & middle incomeLow incomeLower middle incomeLuxembourgMacao SAR, ChinaMacedonia, FYRMadagascarMalawiMaldivesMaliMaltaMarshall IslandsMauritaniaMauritiusMexicoMiddle East & North AfricaMiddle East & North Africa (excluding high income)Middle East & North Africa (IDA & IBRD countries)Middle incomeMoldovaMongoliaMontenegroMoroccoMozambiqueMyanmarNamibiaNauruNepalNetherlandsNew ZealandNicaraguaNigerNigeriaNorwayOECD membersOmanOther small statesPacific island small statesPakistanPalauPanamaPapua New GuineaParaguayPeruPhilippinesPolandPortugalPost-demographic dividendPre-demographic dividendQatarRomaniaRussian FederationRwandaSamoaSan MarinoSao Tome and PrincipeSaudi ArabiaSenegalSerbiaSeychellesSierra LeoneSlovak RepublicSloveniaSmall statesSolomon IslandsSouth AfricaSouth AsiaSouth Asia (IDA & IBRD)South SudanSpainSri LankaSt. Kitts and NevisSt. LuciaSt. Vincent and the GrenadinesSub-Saharan Africa Sub-Saharan Africa (excluding high income)Sub-Saharan Africa (IDA & IBRD countries)SudanSurinameSwazilandSwedenSwitzerlandSyrian Arab RepublicTajikistanTanzaniaThailandTimor-LesteTogoTongaTrinidad and TobagoTunisiaTurkeyTuvaluUgandaUkraineUnited Arab EmiratesUpper middle incomeUruguayUzbekistanVanuatuVenezuela, RBVietnamWest Bank and GazaWorldYemen, Rep.ZambiaZimbabwe Timeline:
This timeline shows a graph from 1976 to 2014 of Tanzania. No data until 1975. Number of actual observations by date: 28.
Source name:
World Development Indicators
Source organization:
United Nations Educational, Scientific, and Cultural Organization (UNESCO) Institute for Statistics.
Categories, topics:
Education, Gender
Last updated:
apr 23, 2017
Indicators value changes by year
Minimum:
26.063
jan 1, 1976
Maximum:
115.199
jan 1, 1985
At the date of observation
Value
Absolute change
Change from previous value
jan 1, 1976
26.063
+26.063
0.0%
jan 1, 1977
28.385
+2.323
8.91%
jan 1, 1982
66.407
+38.021
133.95%
jan 1, 1983
77.74
+11.333
17.07%
jan 1, 1984
84.985
+7.245
9.32%
jan 1, 1985
115.199
+30.215
35.55%
jan 1, 1987
70.758
-44.441
-38.58%
jan 1, 1988
68.912
-1.846
-2.61%
jan 1, 1989
63.877
-5.035
-7.31%
jan 1, 1990
47.052
-16.825
-26.34%
jan 1, 1992
63.553
+16.501
35.07%
jan 1, 1993
54.637
-8.916
-14.03%
jan 1, 1994
57.493
+2.856
5.23%
jan 1, 1995
55.225
-2.268
-3.94%
jan 1, 1998
59.161
+3.936
7.13%
jan 1, 1999
48.729
-10.433
-17.63%
jan 1, 2000
58.807
+10.078
20.68%
jan 1, 2001
50.392
-8.415
-14.31%
jan 1, 2002
56.068
+5.676
11.26%
jan 1, 2003
59.901
+3.833
6.84%
jan 1, 2005
56.826
-3.076
-5.13%
jan 1, 2006
52.485
-4.34
-7.64%
jan 1, 2007
69.02
+16.535
31.5%
jan 1, 2008
78.727
+9.707
14.06%
jan 1, 2010
100.47
+21.742
27.62%
jan 1, 2011
90.155
-10.315
-10.27%
jan 1, 2013
82.614
-7.541
-8.36%
jan 1, 2014
77.097
-5.516
-6.68%
Ranking of countries by current statistics by years


Comments: