29
/
en
AIzaSyAYiBZKx7MnpbEhh9jyipgxe19OcubqV5w
April 1, 2024
178208
Lesotho
LSO
true
2
1
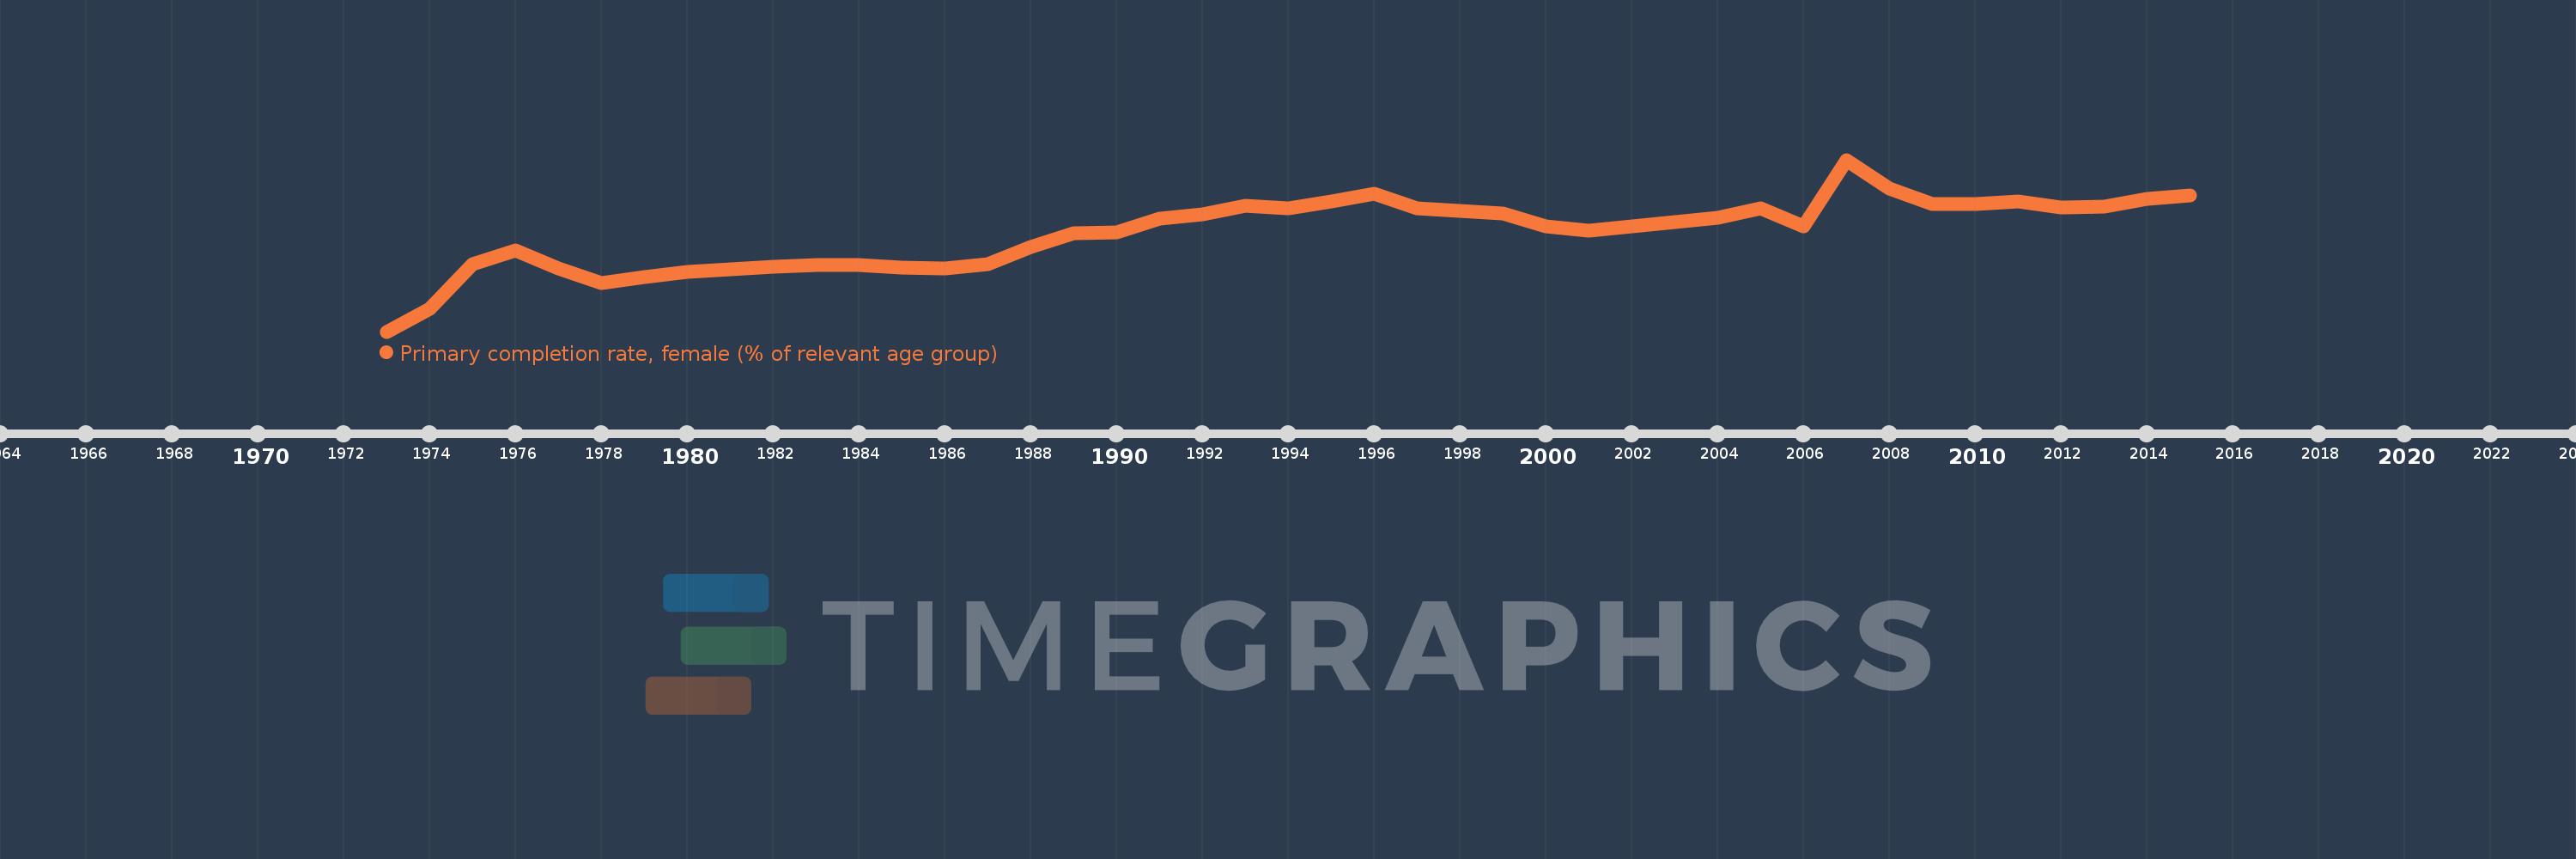
Primary completion rate, female (% of relevant age group)
2015,2014,2013,2012,2011,2010,2009,2008,2007,2006,2005,2004,2003,2002,2001,2000,1999,1998,1997,1996,1995,1994,1993,1992,1991,1990,1989,1988,1987,1986,1985,1984,1983,1982,1981,1980,1979,1978,1977,1976,1975,1974,1973
This statistics in other country:
AfghanistanAlbaniaAlgeriaAngolaAntigua and BarbudaArab WorldArgentinaArmeniaArubaAustriaAzerbaijanBahamas, TheBahrainBangladeshBarbadosBelarusBelgiumBelizeBeninBermudaBhutanBoliviaBosnia and HerzegovinaBotswanaBrunei DarussalamBulgariaBurkina FasoBurundiCabo VerdeCambodiaCameroonCanadaCaribbean small statesCentral African RepublicCentral Europe and the BalticsChadChileChinaColombiaComorosCongo, Dem. Rep.Congo, Rep.Costa RicaCote d'IvoireCroatiaCubaCyprusCzech RepublicDenmarkDjiboutiDominicaDominican RepublicEarly-demographic dividendEast Asia & PacificEast Asia & Pacific (excluding high income)East Asia & Pacific (IDA & IBRD countries)EcuadorEgypt, Arab Rep.El SalvadorEquatorial GuineaEritreaEstoniaEthiopiaEuro areaEurope & Central AsiaEurope & Central Asia (excluding high income)Europe & Central Asia (IDA & IBRD countries)European UnionFijiFinlandFragile and conflict affected situationsFranceGabonGambia, TheGeorgiaGermanyGhanaGreeceGrenadaGuatemalaGuineaGuinea-BissauGuyanaHaitiHeavily indebted poor countries (HIPC)High incomeHondurasHong Kong SAR, ChinaHungaryIBRD onlyIcelandIDA & IBRD totalIDA blendIDA onlyIDA totalIndiaIndonesiaIran, Islamic Rep.IraqIrelandIsraelItalyJamaicaJapanJordanKazakhstanKenyaKiribatiKorea, Dem. People’s Rep.Korea, Rep.KuwaitKyrgyz RepublicLao PDRLate-demographic dividendLatin America & Caribbean Latin America & Caribbean (excluding high income)Latin America & the Caribbean (IDA & IBRD countries)LatviaLeast developed countries: UN classificationLebanonLesothoLiberiaLibyaLiechtensteinLithuaniaLow & middle incomeLow incomeLower middle incomeLuxembourgMacao SAR, ChinaMacedonia, FYRMadagascarMalawiMaldivesMaliMaltaMarshall IslandsMauritaniaMauritiusMexicoMiddle East & North AfricaMiddle East & North Africa (excluding high income)Middle East & North Africa (IDA & IBRD countries)Middle incomeMoldovaMongoliaMontenegroMoroccoMozambiqueMyanmarNamibiaNauruNepalNetherlandsNew ZealandNicaraguaNigerNigeriaNorwayOECD membersOmanOther small statesPacific island small statesPakistanPalauPanamaPapua New GuineaParaguayPeruPhilippinesPolandPortugalPost-demographic dividendPre-demographic dividendQatarRomaniaRussian FederationRwandaSamoaSan MarinoSao Tome and PrincipeSaudi ArabiaSenegalSerbiaSeychellesSierra LeoneSlovak RepublicSloveniaSmall statesSolomon IslandsSouth AfricaSouth AsiaSouth Asia (IDA & IBRD)South SudanSpainSri LankaSt. Kitts and NevisSt. LuciaSt. Vincent and the GrenadinesSub-Saharan Africa Sub-Saharan Africa (excluding high income)Sub-Saharan Africa (IDA & IBRD countries)SudanSurinameSwazilandSwedenSwitzerlandSyrian Arab RepublicTajikistanTanzaniaThailandTimor-LesteTogoTongaTrinidad and TobagoTunisiaTurkeyTuvaluUgandaUkraineUnited Arab EmiratesUpper middle incomeUruguayUzbekistanVanuatuVenezuela, RBVietnamWest Bank and GazaWorldYemen, Rep.ZambiaZimbabwe Timeline:
This timeline shows a graph from 1973 to 2015 of Lesotho. No data until 1972. Number of actual observations by date: 43.
Source name:
World Development Indicators
Source organization:
United Nations Educational, Scientific, and Cultural Organization (UNESCO) Institute for Statistics.
Categories, topics:
Education, Gender
Last updated:
apr 23, 2017
Indicators value changes by year
Minimum:
45.968
jan 1, 1973
Maximum:
95.101
jan 1, 2007
At the date of observation
Value
Absolute change
Change from previous value
jan 1, 1973
45.968
+45.968
0.0%
jan 1, 1974
52.593
+6.625
14.41%
jan 1, 1975
65.248
+12.655
24.06%
jan 1, 1976
69.113
+3.865
5.92%
jan 1, 1977
64.038
-5.075
-7.34%
jan 1, 1978
59.767
-4.271
-6.67%
jan 1, 1979
61.622
+1.855
3.1%
jan 1, 1980
62.957
+1.335
2.17%
jan 1, 1981
63.866
+0.909
1.44%
jan 1, 1982
64.584
+0.719
1.13%
jan 1, 1983
64.956
+0.371
0.58%
jan 1, 1984
64.998
+0.042
0.07%
jan 1, 1985
64.255
-0.744
-1.14%
jan 1, 1986
64.036
-0.219
-0.34%
jan 1, 1987
65.244
+1.208
1.89%
jan 1, 1988
70.119
+4.875
7.47%
jan 1, 1989
73.987
+3.868
5.52%
jan 1, 1990
74.367
+0.38
0.51%
jan 1, 1991
78.253
+3.886
5.23%
jan 1, 1992
79.617
+1.365
1.74%
jan 1, 1993
82.015
+2.398
3.01%
jan 1, 1994
81.287
-0.728
-0.89%
jan 1, 1995
83.192
+1.904
2.34%
jan 1, 1996
85.482
+2.29
2.75%
jan 1, 1997
81.201
-4.281
-5.01%
jan 1, 1998
80.413
-0.788
-0.97%
jan 1, 1999
79.793
-0.62
-0.77%
jan 1, 2000
75.941
-3.852
-4.83%
jan 1, 2001
74.731
-1.21
-1.59%
jan 1, 2002
75.961
+1.23
1.65%
jan 1, 2003
77.381
+1.421
1.87%
jan 1, 2004
78.41
+1.029
1.33%
jan 1, 2005
81.104
+2.694
3.44%
jan 1, 2006
75.941
-5.164
-6.37%
jan 1, 2007
95.101
+19.16
25.23%
jan 1, 2008
86.854
-8.247
-8.67%
jan 1, 2009
82.533
-4.321
-4.97%
jan 1, 2010
82.412
-0.121
-0.15%
jan 1, 2011
83.144
+0.732
0.89%
jan 1, 2012
81.412
-1.731
-2.08%
jan 1, 2013
81.61
+0.198
0.24%
jan 1, 2014
83.965
+2.355
2.89%
jan 1, 2015
84.875
+0.911
1.08%
Ranking of countries by current statistics by years


Comments: