29
/
en
AIzaSyAYiBZKx7MnpbEhh9jyipgxe19OcubqV5w
April 1, 2024
50391
Middle East & North Africa (IDA & IBRD countries)
TMN
false
2
1
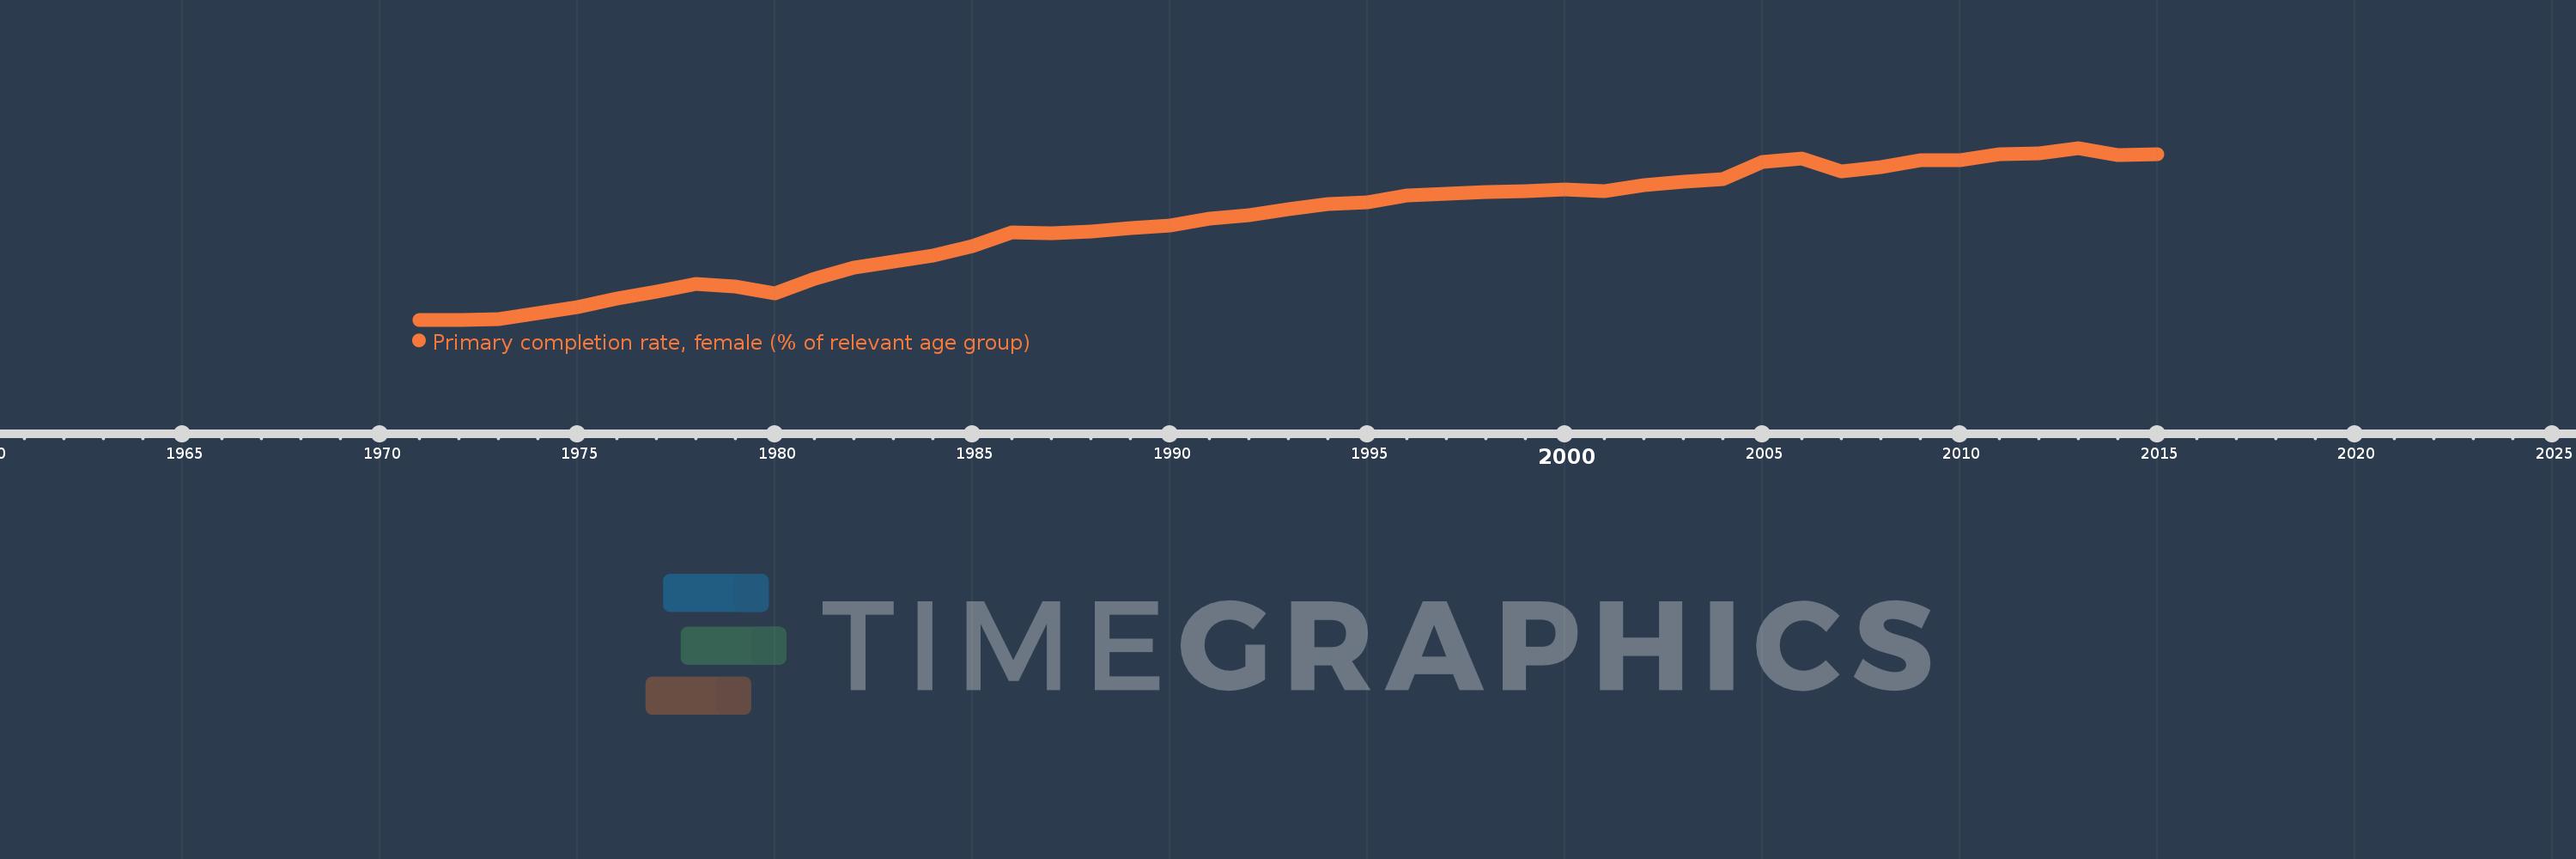
Primary completion rate, female (% of relevant age group)
2015,2014,2013,2012,2011,2010,2009,2008,2007,2006,2005,2004,2003,2002,2001,2000,1999,1998,1997,1996,1995,1994,1993,1992,1991,1990,1989,1988,1987,1986,1985,1984,1983,1982,1981,1980,1979,1978,1977,1976,1975,1974,1973,1972,1971
This statistics in other country:
AfghanistanAlbaniaAlgeriaAngolaAntigua and BarbudaArab WorldArgentinaArmeniaArubaAustriaAzerbaijanBahamas, TheBahrainBangladeshBarbadosBelarusBelgiumBelizeBeninBermudaBhutanBoliviaBosnia and HerzegovinaBotswanaBrunei DarussalamBulgariaBurkina FasoBurundiCabo VerdeCambodiaCameroonCanadaCaribbean small statesCentral African RepublicCentral Europe and the BalticsChadChileChinaColombiaComorosCongo, Dem. Rep.Congo, Rep.Costa RicaCote d'IvoireCroatiaCubaCyprusCzech RepublicDenmarkDjiboutiDominicaDominican RepublicEarly-demographic dividendEast Asia & PacificEast Asia & Pacific (excluding high income)East Asia & Pacific (IDA & IBRD countries)EcuadorEgypt, Arab Rep.El SalvadorEquatorial GuineaEritreaEstoniaEthiopiaEuro areaEurope & Central AsiaEurope & Central Asia (excluding high income)Europe & Central Asia (IDA & IBRD countries)European UnionFijiFinlandFragile and conflict affected situationsFranceGabonGambia, TheGeorgiaGermanyGhanaGreeceGrenadaGuatemalaGuineaGuinea-BissauGuyanaHaitiHeavily indebted poor countries (HIPC)High incomeHondurasHong Kong SAR, ChinaHungaryIBRD onlyIcelandIDA & IBRD totalIDA blendIDA onlyIDA totalIndiaIndonesiaIran, Islamic Rep.IraqIrelandIsraelItalyJamaicaJapanJordanKazakhstanKenyaKiribatiKorea, Dem. People’s Rep.Korea, Rep.KuwaitKyrgyz RepublicLao PDRLate-demographic dividendLatin America & Caribbean Latin America & Caribbean (excluding high income)Latin America & the Caribbean (IDA & IBRD countries)LatviaLeast developed countries: UN classificationLebanonLesothoLiberiaLibyaLiechtensteinLithuaniaLow & middle incomeLow incomeLower middle incomeLuxembourgMacao SAR, ChinaMacedonia, FYRMadagascarMalawiMaldivesMaliMaltaMarshall IslandsMauritaniaMauritiusMexicoMiddle East & North AfricaMiddle East & North Africa (excluding high income)Middle East & North Africa (IDA & IBRD countries)Middle incomeMoldovaMongoliaMontenegroMoroccoMozambiqueMyanmarNamibiaNauruNepalNetherlandsNew ZealandNicaraguaNigerNigeriaNorwayOECD membersOmanOther small statesPacific island small statesPakistanPalauPanamaPapua New GuineaParaguayPeruPhilippinesPolandPortugalPost-demographic dividendPre-demographic dividendQatarRomaniaRussian FederationRwandaSamoaSan MarinoSao Tome and PrincipeSaudi ArabiaSenegalSerbiaSeychellesSierra LeoneSlovak RepublicSloveniaSmall statesSolomon IslandsSouth AfricaSouth AsiaSouth Asia (IDA & IBRD)South SudanSpainSri LankaSt. Kitts and NevisSt. LuciaSt. Vincent and the GrenadinesSub-Saharan Africa Sub-Saharan Africa (excluding high income)Sub-Saharan Africa (IDA & IBRD countries)SudanSurinameSwazilandSwedenSwitzerlandSyrian Arab RepublicTajikistanTanzaniaThailandTimor-LesteTogoTongaTrinidad and TobagoTunisiaTurkeyTuvaluUgandaUkraineUnited Arab EmiratesUpper middle incomeUruguayUzbekistanVanuatuVenezuela, RBVietnamWest Bank and GazaWorldYemen, Rep.ZambiaZimbabwe Timeline:
This timeline shows a graph from 1971 to 2015 of Middle East & North Africa (IDA & IBRD countries). No data until 1970. Number of actual observations by date: 45.
Source name:
World Development Indicators
Source organization:
United Nations Educational, Scientific, and Cultural Organization (UNESCO) Institute for Statistics.
Categories, topics:
Education, Gender
Last updated:
apr 23, 2017
Indicators value changes by year
Minimum:
34.368
jan 1, 1972
Maximum:
91.474
jan 1, 2013
At the date of observation
Value
Absolute change
Change from previous value
jan 1, 1971
34.384
+34.384
0.0%
jan 1, 1972
34.368
-0.016
-0.05%
jan 1, 1973
34.646
+0.278
0.81%
jan 1, 1974
36.601
+1.955
5.64%
jan 1, 1975
38.678
+2.077
5.67%
jan 1, 1976
41.532
+2.854
7.38%
jan 1, 1977
43.665
+2.133
5.13%
jan 1, 1978
46.17
+2.505
5.74%
jan 1, 1979
45.542
-0.628
-1.36%
jan 1, 1980
43.229
-2.313
-5.08%
jan 1, 1981
47.924
+4.696
10.86%
jan 1, 1982
51.689
+3.764
7.85%
jan 1, 1983
53.658
+1.969
3.81%
jan 1, 1984
55.752
+2.094
3.9%
jan 1, 1985
58.727
+2.976
5.34%
jan 1, 1986
63.424
+4.697
8.0%
jan 1, 1987
63.246
-0.178
-0.28%
jan 1, 1988
63.665
+0.419
0.66%
jan 1, 1989
64.839
+1.174
1.84%
jan 1, 1990
65.584
+0.745
1.15%
jan 1, 1991
67.991
+2.408
3.67%
jan 1, 1992
69.251
+1.26
1.85%
jan 1, 1993
71.136
+1.885
2.72%
jan 1, 1994
72.874
+1.737
2.44%
jan 1, 1995
73.431
+0.557
0.76%
jan 1, 1996
75.611
+2.18
2.97%
jan 1, 1997
76.239
+0.628
0.83%
jan 1, 1998
76.728
+0.489
0.64%
jan 1, 1999
77.247
+0.52
0.68%
jan 1, 2000
77.825
+0.577
0.75%
jan 1, 2001
77.082
-0.743
-0.95%
jan 1, 2002
79.108
+2.027
2.63%
jan 1, 2003
80.242
+1.133
1.43%
jan 1, 2004
81.138
+0.896
1.12%
jan 1, 2005
86.829
+5.691
7.01%
jan 1, 2006
88.076
+1.247
1.44%
jan 1, 2007
83.726
-4.35
-4.94%
jan 1, 2008
85.183
+1.457
1.74%
jan 1, 2009
87.383
+2.2
2.58%
jan 1, 2010
87.275
-0.108
-0.12%
jan 1, 2011
89.384
+2.109
2.42%
jan 1, 2012
89.674
+0.29
0.32%
jan 1, 2013
91.474
+1.8
2.01%
jan 1, 2014
88.978
-2.496
-2.73%
jan 1, 2015
89.515
+0.536
0.6%
Ranking of countries by current statistics by years


Comments: