29
/
en
AIzaSyAYiBZKx7MnpbEhh9jyipgxe19OcubqV5w
April 1, 2024
221469
Paraguay
PRY
true
2
1
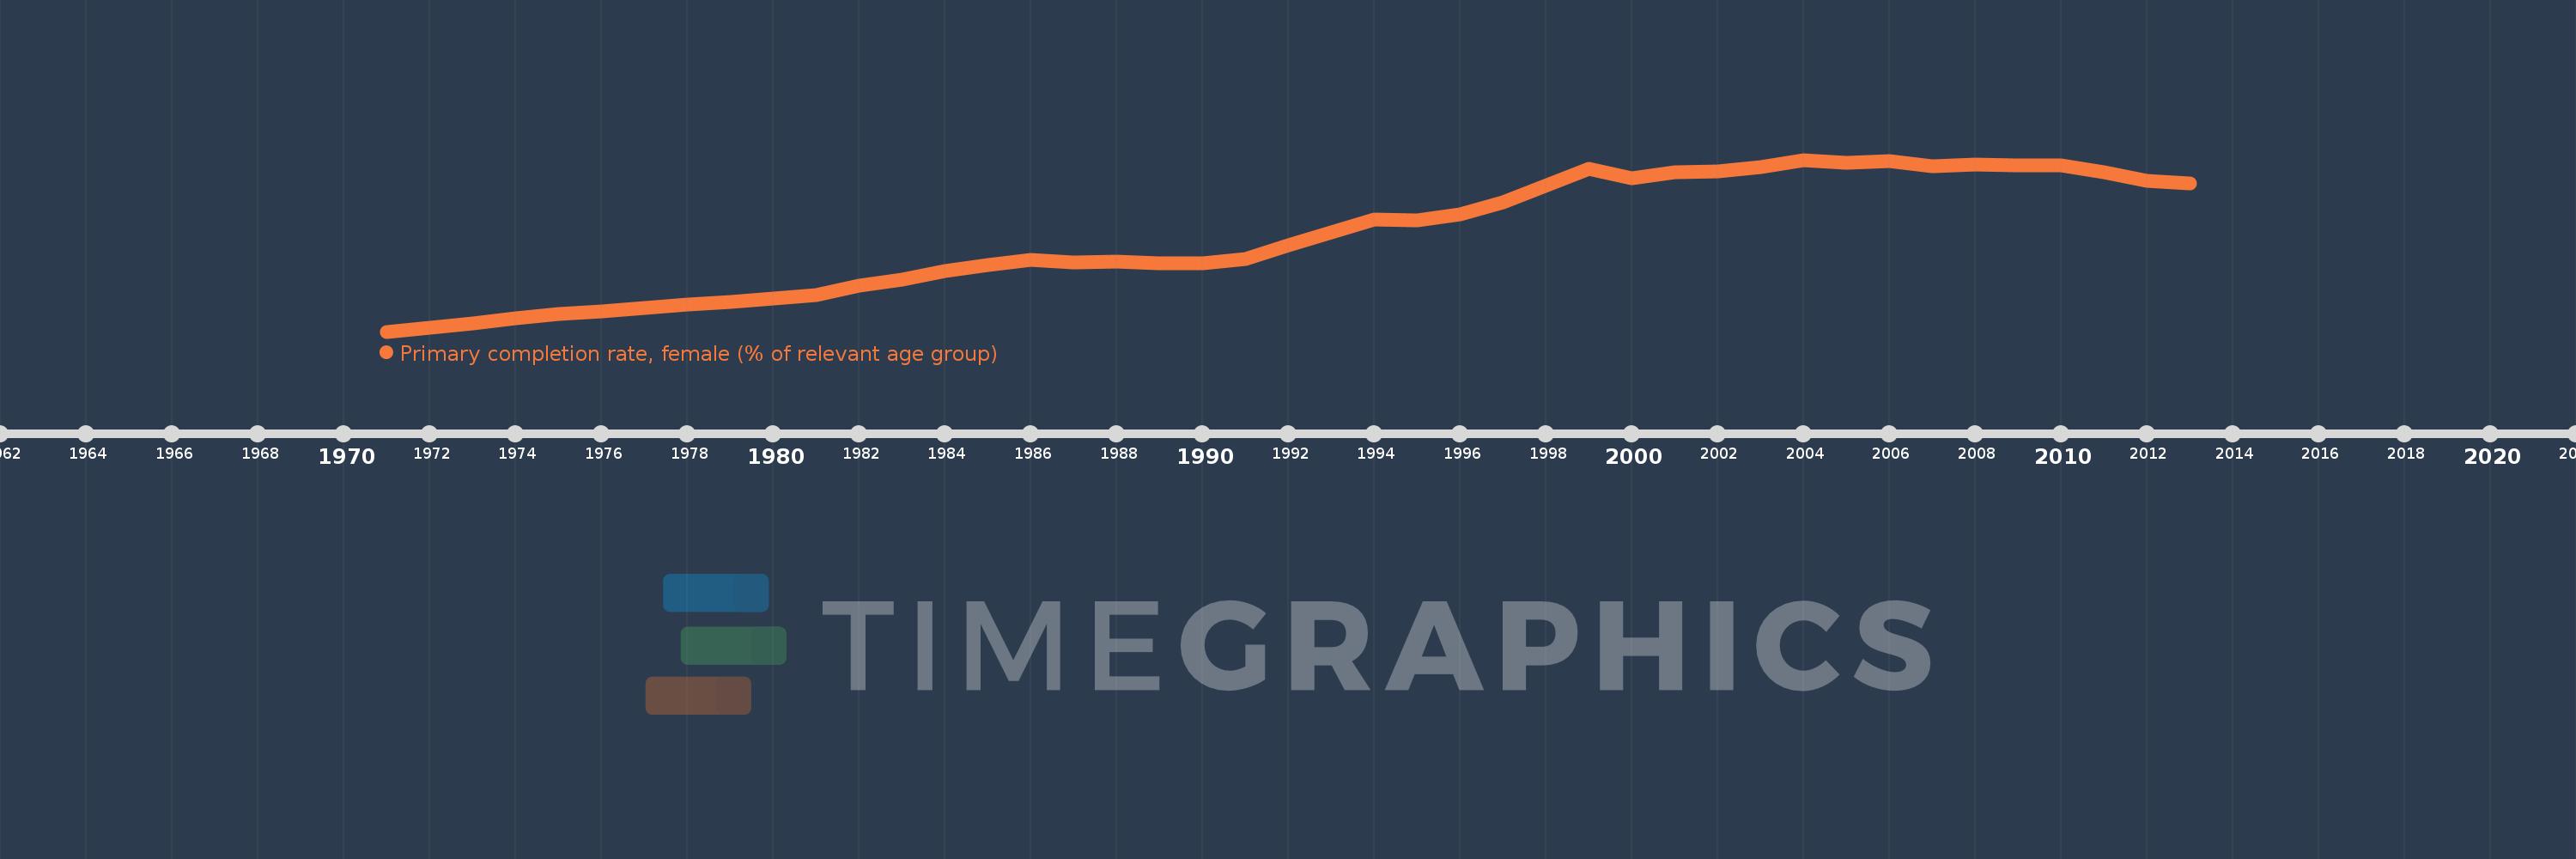
Primary completion rate, female (% of relevant age group)
2013,2012,2011,2010,2009,2008,2007,2006,2005,2004,2003,2002,2001,2000,1999,1997,1996,1995,1994,1993,1992,1991,1990,1989,1988,1987,1986,1985,1984,1983,1982,1981,1979,1978,1977,1976,1975,1974,1973,1971
This statistics in other country:
AfghanistanAlbaniaAlgeriaAngolaAntigua and BarbudaArab WorldArgentinaArmeniaArubaAustriaAzerbaijanBahamas, TheBahrainBangladeshBarbadosBelarusBelgiumBelizeBeninBermudaBhutanBoliviaBosnia and HerzegovinaBotswanaBrunei DarussalamBulgariaBurkina FasoBurundiCabo VerdeCambodiaCameroonCanadaCaribbean small statesCentral African RepublicCentral Europe and the BalticsChadChileChinaColombiaComorosCongo, Dem. Rep.Congo, Rep.Costa RicaCote d'IvoireCroatiaCubaCyprusCzech RepublicDenmarkDjiboutiDominicaDominican RepublicEarly-demographic dividendEast Asia & PacificEast Asia & Pacific (excluding high income)East Asia & Pacific (IDA & IBRD countries)EcuadorEgypt, Arab Rep.El SalvadorEquatorial GuineaEritreaEstoniaEthiopiaEuro areaEurope & Central AsiaEurope & Central Asia (excluding high income)Europe & Central Asia (IDA & IBRD countries)European UnionFijiFinlandFragile and conflict affected situationsFranceGabonGambia, TheGeorgiaGermanyGhanaGreeceGrenadaGuatemalaGuineaGuinea-BissauGuyanaHaitiHeavily indebted poor countries (HIPC)High incomeHondurasHong Kong SAR, ChinaHungaryIBRD onlyIcelandIDA & IBRD totalIDA blendIDA onlyIDA totalIndiaIndonesiaIran, Islamic Rep.IraqIrelandIsraelItalyJamaicaJapanJordanKazakhstanKenyaKiribatiKorea, Dem. People’s Rep.Korea, Rep.KuwaitKyrgyz RepublicLao PDRLate-demographic dividendLatin America & Caribbean Latin America & Caribbean (excluding high income)Latin America & the Caribbean (IDA & IBRD countries)LatviaLeast developed countries: UN classificationLebanonLesothoLiberiaLibyaLiechtensteinLithuaniaLow & middle incomeLow incomeLower middle incomeLuxembourgMacao SAR, ChinaMacedonia, FYRMadagascarMalawiMaldivesMaliMaltaMarshall IslandsMauritaniaMauritiusMexicoMiddle East & North AfricaMiddle East & North Africa (excluding high income)Middle East & North Africa (IDA & IBRD countries)Middle incomeMoldovaMongoliaMontenegroMoroccoMozambiqueMyanmarNamibiaNauruNepalNetherlandsNew ZealandNicaraguaNigerNigeriaNorwayOECD membersOmanOther small statesPacific island small statesPakistanPalauPanamaPapua New GuineaParaguayPeruPhilippinesPolandPortugalPost-demographic dividendPre-demographic dividendQatarRomaniaRussian FederationRwandaSamoaSan MarinoSao Tome and PrincipeSaudi ArabiaSenegalSerbiaSeychellesSierra LeoneSlovak RepublicSloveniaSmall statesSolomon IslandsSouth AfricaSouth AsiaSouth Asia (IDA & IBRD)South SudanSpainSri LankaSt. Kitts and NevisSt. LuciaSt. Vincent and the GrenadinesSub-Saharan Africa Sub-Saharan Africa (excluding high income)Sub-Saharan Africa (IDA & IBRD countries)SudanSurinameSwazilandSwedenSwitzerlandSyrian Arab RepublicTajikistanTanzaniaThailandTimor-LesteTogoTongaTrinidad and TobagoTunisiaTurkeyTuvaluUgandaUkraineUnited Arab EmiratesUpper middle incomeUruguayUzbekistanVanuatuVenezuela, RBVietnamWest Bank and GazaWorldYemen, Rep.ZambiaZimbabwe Timeline:
This timeline shows a graph from 1971 to 2013 of Paraguay. No data until 1970. Number of actual observations by date: 40.
Source name:
World Development Indicators
Source organization:
United Nations Educational, Scientific, and Cultural Organization (UNESCO) Institute for Statistics.
Categories, topics:
Education, Gender
Last updated:
apr 23, 2017
Indicators value changes by year
Minimum:
42.169
jan 1, 1971
Maximum:
97.004
jan 1, 2004
At the date of observation
Value
Absolute change
Change from previous value
jan 1, 1971
42.169
+42.169
0.0%
jan 1, 1973
44.715
+2.546
6.04%
jan 1, 1974
46.412
+1.697
3.8%
jan 1, 1975
47.732
+1.32
2.84%
jan 1, 1976
48.504
+0.772
1.62%
jan 1, 1977
49.693
+1.189
2.45%
jan 1, 1978
50.928
+1.235
2.49%
jan 1, 1979
51.693
+0.765
1.5%
jan 1, 1981
53.778
+2.085
4.03%
jan 1, 1982
56.948
+3.169
5.89%
jan 1, 1983
58.721
+1.773
3.11%
jan 1, 1984
61.473
+2.753
4.69%
jan 1, 1985
63.394
+1.92
3.12%
jan 1, 1986
65.179
+1.785
2.82%
jan 1, 1987
64.108
-1.071
-1.64%
jan 1, 1988
64.395
+0.287
0.45%
jan 1, 1989
63.845
-0.55
-0.85%
jan 1, 1990
64.095
+0.251
0.39%
jan 1, 1991
65.297
+1.202
1.88%
jan 1, 1992
69.747
+4.45
6.82%
jan 1, 1993
73.756
+4.009
5.75%
jan 1, 1994
77.919
+4.163
5.64%
jan 1, 1995
77.595
-0.324
-0.42%
jan 1, 1996
79.636
+2.041
2.63%
jan 1, 1997
83.373
+3.737
4.69%
jan 1, 1999
94.002
+10.629
12.75%
jan 1, 2000
91.016
-2.986
-3.18%
jan 1, 2001
92.929
+1.914
2.1%
jan 1, 2002
93.402
+0.473
0.51%
jan 1, 2003
94.54
+1.138
1.22%
jan 1, 2004
97.004
+2.463
2.61%
jan 1, 2005
96.047
-0.957
-0.99%
jan 1, 2006
96.516
+0.468
0.49%
jan 1, 2007
94.823
-1.692
-1.75%
jan 1, 2008
95.627
+0.804
0.85%
jan 1, 2009
95.246
-0.381
-0.4%
jan 1, 2010
95.261
+0.014
0.02%
jan 1, 2011
93.11
-2.151
-2.26%
jan 1, 2012
90.245
-2.865
-3.08%
jan 1, 2013
89.57
-0.675
-0.75%
Ranking of countries by current statistics by years


Comments: