29
/
en
AIzaSyAYiBZKx7MnpbEhh9jyipgxe19OcubqV5w
April 1, 2024
124117
Ecuador
ECU
true
2
1
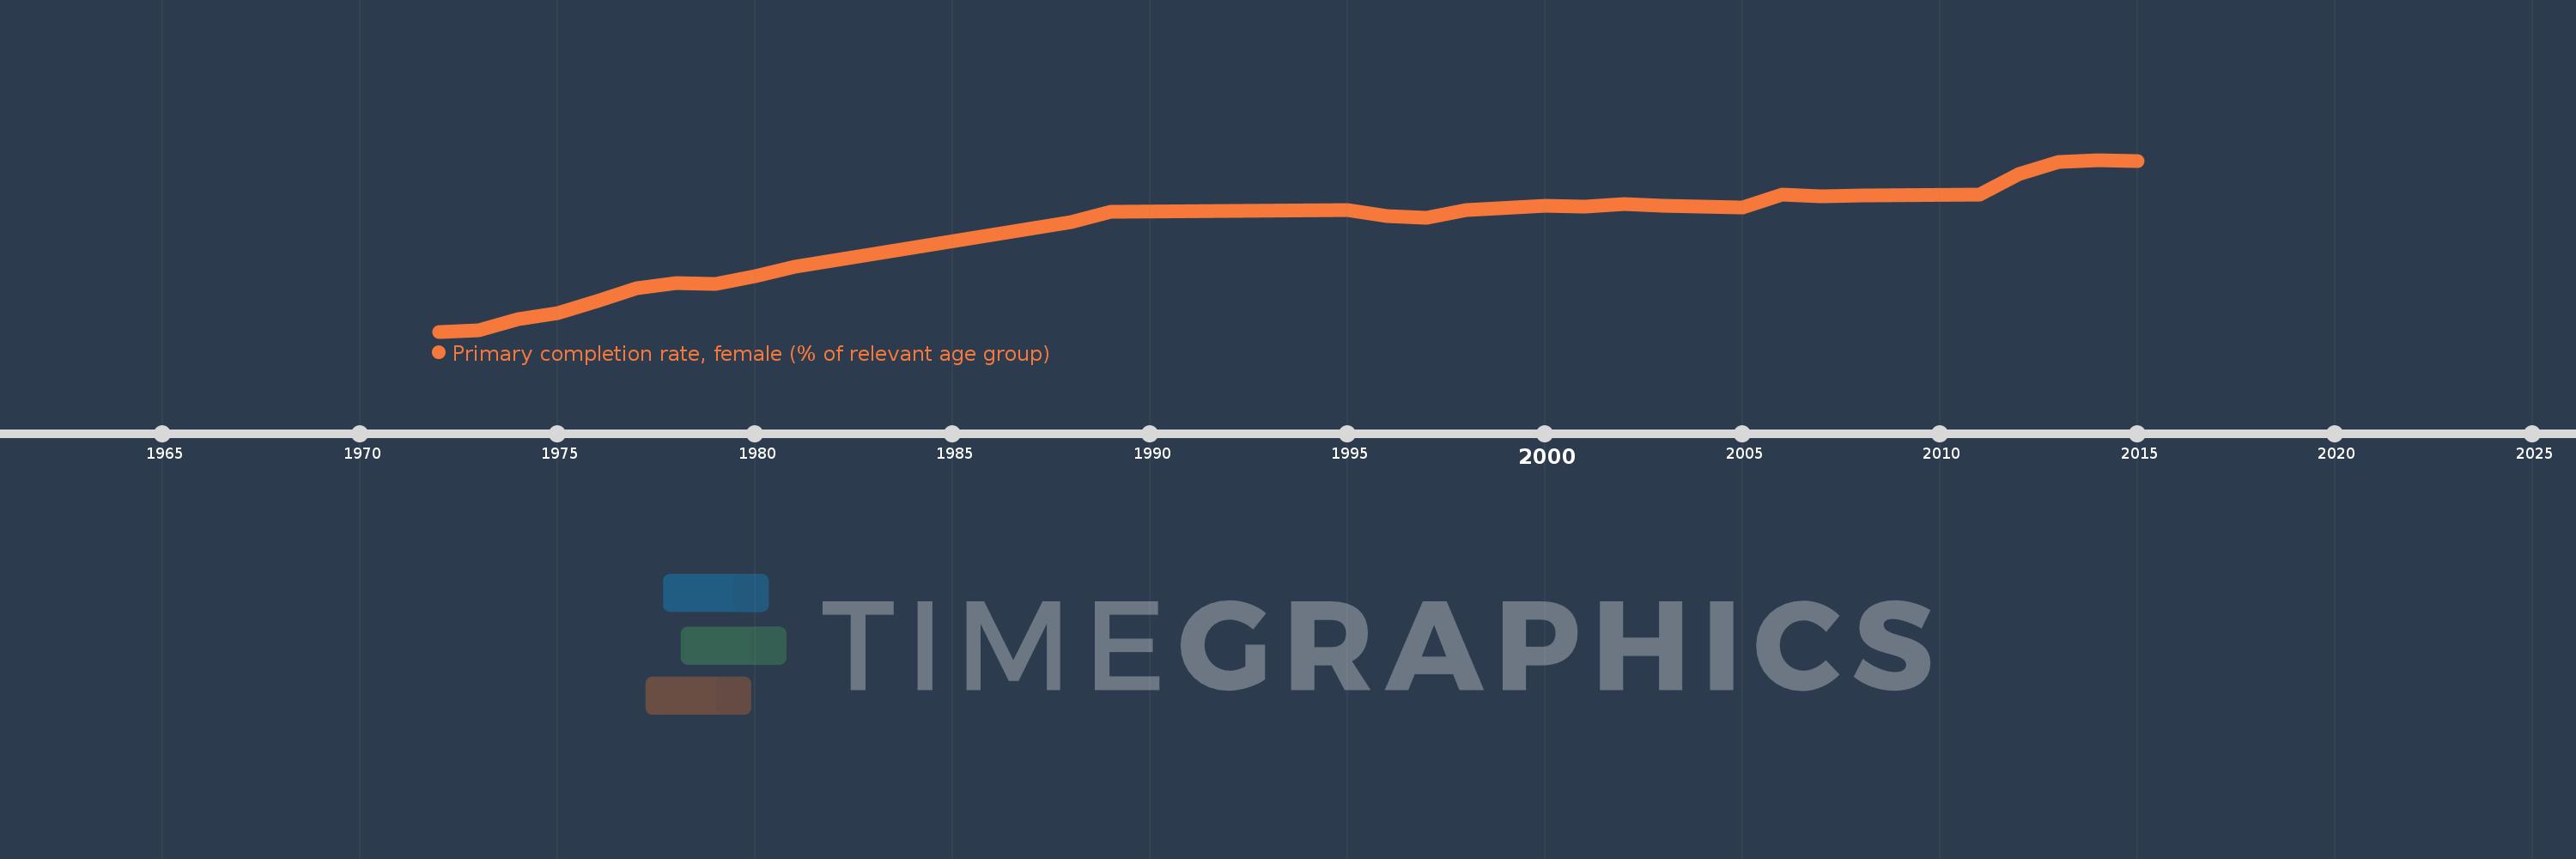
Primary completion rate, female (% of relevant age group)
2015,2014,2013,2012,2011,2008,2007,2006,2005,2004,2003,2002,2001,2000,1998,1997,1996,1995,1989,1988,1981,1980,1979,1978,1977,1976,1975,1974,1973,1972
This statistics in other country:
AfghanistanAlbaniaAlgeriaAngolaAntigua and BarbudaArab WorldArgentinaArmeniaArubaAustriaAzerbaijanBahamas, TheBahrainBangladeshBarbadosBelarusBelgiumBelizeBeninBermudaBhutanBoliviaBosnia and HerzegovinaBotswanaBrunei DarussalamBulgariaBurkina FasoBurundiCabo VerdeCambodiaCameroonCanadaCaribbean small statesCentral African RepublicCentral Europe and the BalticsChadChileChinaColombiaComorosCongo, Dem. Rep.Congo, Rep.Costa RicaCote d'IvoireCroatiaCubaCyprusCzech RepublicDenmarkDjiboutiDominicaDominican RepublicEarly-demographic dividendEast Asia & PacificEast Asia & Pacific (excluding high income)East Asia & Pacific (IDA & IBRD countries)EcuadorEgypt, Arab Rep.El SalvadorEquatorial GuineaEritreaEstoniaEthiopiaEuro areaEurope & Central AsiaEurope & Central Asia (excluding high income)Europe & Central Asia (IDA & IBRD countries)European UnionFijiFinlandFragile and conflict affected situationsFranceGabonGambia, TheGeorgiaGermanyGhanaGreeceGrenadaGuatemalaGuineaGuinea-BissauGuyanaHaitiHeavily indebted poor countries (HIPC)High incomeHondurasHong Kong SAR, ChinaHungaryIBRD onlyIcelandIDA & IBRD totalIDA blendIDA onlyIDA totalIndiaIndonesiaIran, Islamic Rep.IraqIrelandIsraelItalyJamaicaJapanJordanKazakhstanKenyaKiribatiKorea, Dem. People’s Rep.Korea, Rep.KuwaitKyrgyz RepublicLao PDRLate-demographic dividendLatin America & Caribbean Latin America & Caribbean (excluding high income)Latin America & the Caribbean (IDA & IBRD countries)LatviaLeast developed countries: UN classificationLebanonLesothoLiberiaLibyaLiechtensteinLithuaniaLow & middle incomeLow incomeLower middle incomeLuxembourgMacao SAR, ChinaMacedonia, FYRMadagascarMalawiMaldivesMaliMaltaMarshall IslandsMauritaniaMauritiusMexicoMiddle East & North AfricaMiddle East & North Africa (excluding high income)Middle East & North Africa (IDA & IBRD countries)Middle incomeMoldovaMongoliaMontenegroMoroccoMozambiqueMyanmarNamibiaNauruNepalNetherlandsNew ZealandNicaraguaNigerNigeriaNorwayOECD membersOmanOther small statesPacific island small statesPakistanPalauPanamaPapua New GuineaParaguayPeruPhilippinesPolandPortugalPost-demographic dividendPre-demographic dividendQatarRomaniaRussian FederationRwandaSamoaSan MarinoSao Tome and PrincipeSaudi ArabiaSenegalSerbiaSeychellesSierra LeoneSlovak RepublicSloveniaSmall statesSolomon IslandsSouth AfricaSouth AsiaSouth Asia (IDA & IBRD)South SudanSpainSri LankaSt. Kitts and NevisSt. LuciaSt. Vincent and the GrenadinesSub-Saharan Africa Sub-Saharan Africa (excluding high income)Sub-Saharan Africa (IDA & IBRD countries)SudanSurinameSwazilandSwedenSwitzerlandSyrian Arab RepublicTajikistanTanzaniaThailandTimor-LesteTogoTongaTrinidad and TobagoTunisiaTurkeyTuvaluUgandaUkraineUnited Arab EmiratesUpper middle incomeUruguayUzbekistanVanuatuVenezuela, RBVietnamWest Bank and GazaWorldYemen, Rep.ZambiaZimbabwe Timeline:
This timeline shows a graph from 1972 to 2015 of Ecuador. No data until 1971. Number of actual observations by date: 30.
Source name:
World Development Indicators
Source organization:
United Nations Educational, Scientific, and Cultural Organization (UNESCO) Institute for Statistics.
Categories, topics:
Education, Gender
Last updated:
apr 23, 2017
Indicators value changes by year
Maximum:
113.654
jan 1, 2014
At the date of observation
Value
Absolute change
Change from previous value
jan 1, 1972
53.47
+53.47
0.0%
jan 1, 1973
53.893
+0.422
0.79%
jan 1, 1974
57.698
+3.806
7.06%
jan 1, 1975
59.902
+2.204
3.82%
jan 1, 1976
64.037
+4.135
6.9%
jan 1, 1977
68.546
+4.509
7.04%
jan 1, 1978
70.583
+2.036
2.97%
jan 1, 1979
70.047
-0.536
-0.76%
jan 1, 1980
73.009
+2.962
4.23%
jan 1, 1981
76.053
+3.044
4.17%
jan 1, 1988
91.898
+15.845
20.83%
jan 1, 1989
95.426
+3.529
3.84%
jan 1, 1995
96.176
+0.75
0.79%
jan 1, 1996
94.017
-2.159
-2.25%
jan 1, 1997
93.266
-0.751
-0.8%
jan 1, 1998
96.044
+2.778
2.98%
jan 1, 2000
97.489
+1.446
1.51%
jan 1, 2001
97.264
-0.226
-0.23%
jan 1, 2002
98.161
+0.897
0.92%
jan 1, 2003
97.546
-0.615
-0.63%
jan 1, 2004
97.203
-0.343
-0.35%
jan 1, 2005
96.953
-0.249
-0.26%
jan 1, 2006
101.412
+4.458
4.6%
jan 1, 2007
100.76
-0.651
-0.64%
jan 1, 2008
101.233
+0.473
0.47%
jan 1, 2011
101.491
+0.258
0.25%
jan 1, 2012
108.828
+7.337
7.23%
jan 1, 2013
112.865
+4.037
3.71%
jan 1, 2014
113.654
+0.789
0.7%
jan 1, 2015
113.228
-0.427
-0.38%
Ranking of countries by current statistics by years


Comments: