29
/
en
AIzaSyAYiBZKx7MnpbEhh9jyipgxe19OcubqV5w
April 1, 2024
95451
Burkina Faso
BFA
true
2
1
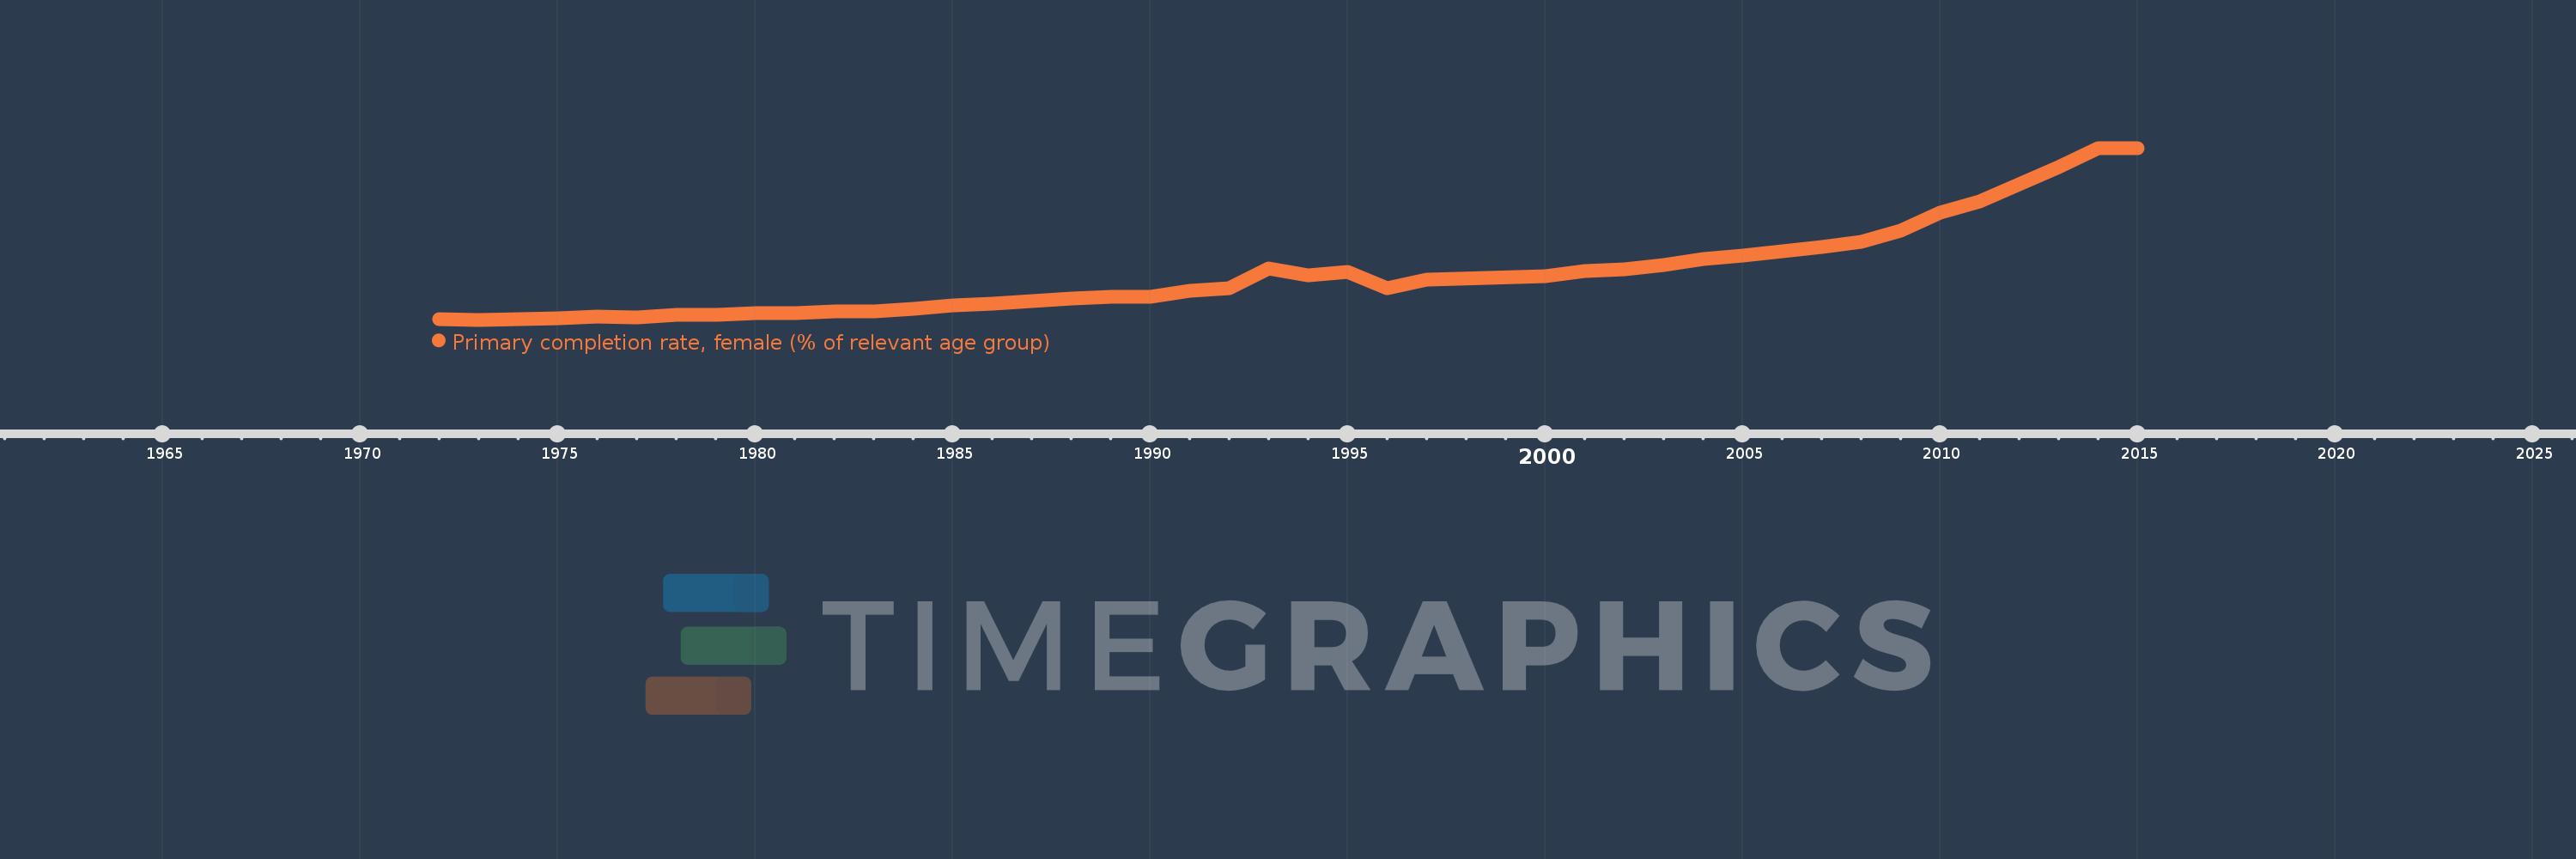
Primary completion rate, female (% of relevant age group)
2015,2014,2013,2011,2010,2009,2008,2007,2006,2005,2004,2003,2002,2001,2000,1997,1996,1995,1994,1993,1992,1991,1990,1989,1988,1986,1985,1984,1983,1982,1981,1980,1979,1978,1977,1976,1975,1974,1973,1972
This statistics in other country:
AfghanistanAlbaniaAlgeriaAngolaAntigua and BarbudaArab WorldArgentinaArmeniaArubaAustriaAzerbaijanBahamas, TheBahrainBangladeshBarbadosBelarusBelgiumBelizeBeninBermudaBhutanBoliviaBosnia and HerzegovinaBotswanaBrunei DarussalamBulgariaBurkina FasoBurundiCabo VerdeCambodiaCameroonCanadaCaribbean small statesCentral African RepublicCentral Europe and the BalticsChadChileChinaColombiaComorosCongo, Dem. Rep.Congo, Rep.Costa RicaCote d'IvoireCroatiaCubaCyprusCzech RepublicDenmarkDjiboutiDominicaDominican RepublicEarly-demographic dividendEast Asia & PacificEast Asia & Pacific (excluding high income)East Asia & Pacific (IDA & IBRD countries)EcuadorEgypt, Arab Rep.El SalvadorEquatorial GuineaEritreaEstoniaEthiopiaEuro areaEurope & Central AsiaEurope & Central Asia (excluding high income)Europe & Central Asia (IDA & IBRD countries)European UnionFijiFinlandFragile and conflict affected situationsFranceGabonGambia, TheGeorgiaGermanyGhanaGreeceGrenadaGuatemalaGuineaGuinea-BissauGuyanaHaitiHeavily indebted poor countries (HIPC)High incomeHondurasHong Kong SAR, ChinaHungaryIBRD onlyIcelandIDA & IBRD totalIDA blendIDA onlyIDA totalIndiaIndonesiaIran, Islamic Rep.IraqIrelandIsraelItalyJamaicaJapanJordanKazakhstanKenyaKiribatiKorea, Dem. People’s Rep.Korea, Rep.KuwaitKyrgyz RepublicLao PDRLate-demographic dividendLatin America & Caribbean Latin America & Caribbean (excluding high income)Latin America & the Caribbean (IDA & IBRD countries)LatviaLeast developed countries: UN classificationLebanonLesothoLiberiaLibyaLiechtensteinLithuaniaLow & middle incomeLow incomeLower middle incomeLuxembourgMacao SAR, ChinaMacedonia, FYRMadagascarMalawiMaldivesMaliMaltaMarshall IslandsMauritaniaMauritiusMexicoMiddle East & North AfricaMiddle East & North Africa (excluding high income)Middle East & North Africa (IDA & IBRD countries)Middle incomeMoldovaMongoliaMontenegroMoroccoMozambiqueMyanmarNamibiaNauruNepalNetherlandsNew ZealandNicaraguaNigerNigeriaNorwayOECD membersOmanOther small statesPacific island small statesPakistanPalauPanamaPapua New GuineaParaguayPeruPhilippinesPolandPortugalPost-demographic dividendPre-demographic dividendQatarRomaniaRussian FederationRwandaSamoaSan MarinoSao Tome and PrincipeSaudi ArabiaSenegalSerbiaSeychellesSierra LeoneSlovak RepublicSloveniaSmall statesSolomon IslandsSouth AfricaSouth AsiaSouth Asia (IDA & IBRD)South SudanSpainSri LankaSt. Kitts and NevisSt. LuciaSt. Vincent and the GrenadinesSub-Saharan Africa Sub-Saharan Africa (excluding high income)Sub-Saharan Africa (IDA & IBRD countries)SudanSurinameSwazilandSwedenSwitzerlandSyrian Arab RepublicTajikistanTanzaniaThailandTimor-LesteTogoTongaTrinidad and TobagoTunisiaTurkeyTuvaluUgandaUkraineUnited Arab EmiratesUpper middle incomeUruguayUzbekistanVanuatuVenezuela, RBVietnamWest Bank and GazaWorldYemen, Rep.ZambiaZimbabwe Timeline:
This timeline shows a graph from 1972 to 2015 of Burkina Faso. No data until 1971. Number of actual observations by date: 40.
Source name:
World Development Indicators
Source organization:
United Nations Educational, Scientific, and Cultural Organization (UNESCO) Institute for Statistics.
Categories, topics:
Education, Gender
Last updated:
apr 23, 2017
Indicators value changes by year
Maximum:
62.086
jan 1, 2015
At the date of observation
Value
Absolute change
Change from previous value
jan 1, 1972
4.743
+4.743
0.0%
jan 1, 1973
4.602
-0.141
-2.97%
jan 1, 1974
4.922
+0.319
6.94%
jan 1, 1975
5.017
+0.095
1.93%
jan 1, 1976
5.548
+0.531
10.59%
jan 1, 1977
5.447
-0.101
-1.81%
jan 1, 1978
6.355
+0.907
16.66%
jan 1, 1979
6.355
+0.0
0.0%
jan 1, 1980
6.863
+0.508
8.0%
jan 1, 1981
6.722
-0.141
-2.06%
jan 1, 1982
7.291
+0.568
8.45%
jan 1, 1983
7.523
+0.233
3.19%
jan 1, 1984
8.206
+0.683
9.07%
jan 1, 1985
9.477
+1.272
15.5%
jan 1, 1986
10.101
+0.624
6.58%
jan 1, 1988
11.586
+1.485
14.7%
jan 1, 1989
12.419
+0.833
7.19%
jan 1, 1990
12.17
-0.249
-2.0%
jan 1, 1991
14.232
+2.061
16.94%
jan 1, 1992
15.125
+0.893
6.28%
jan 1, 1993
21.7
+6.575
43.47%
jan 1, 1994
19.467
-2.234
-10.29%
jan 1, 1995
20.494
+1.028
5.28%
jan 1, 1996
15.283
-5.212
-25.43%
jan 1, 1997
18.037
+2.755
18.03%
jan 1, 2000
19.208
+1.17
6.49%
jan 1, 2001
20.869
+1.662
8.65%
jan 1, 2002
21.613
+0.744
3.57%
jan 1, 2003
22.842
+1.229
5.68%
jan 1, 2004
24.803
+1.961
8.59%
jan 1, 2005
26.17
+1.367
5.51%
jan 1, 2006
27.471
+1.3
4.97%
jan 1, 2007
28.87
+1.4
5.1%
jan 1, 2008
30.68
+1.809
6.27%
jan 1, 2009
34.31
+3.63
11.83%
jan 1, 2010
40.464
+6.154
17.94%
jan 1, 2011
44.161
+3.697
9.14%
jan 1, 2013
55.779
+11.618
26.31%
jan 1, 2014
62.047
+6.267
11.24%
jan 1, 2015
62.086
+0.04
0.06%
Ranking of countries by current statistics by years


Comments: