30
/
AIzaSyAYiBZKx7MnpbEhh9jyipgxe19OcubqV5w
April 1, 2024
141020
Ghana
GHA
true
2
1
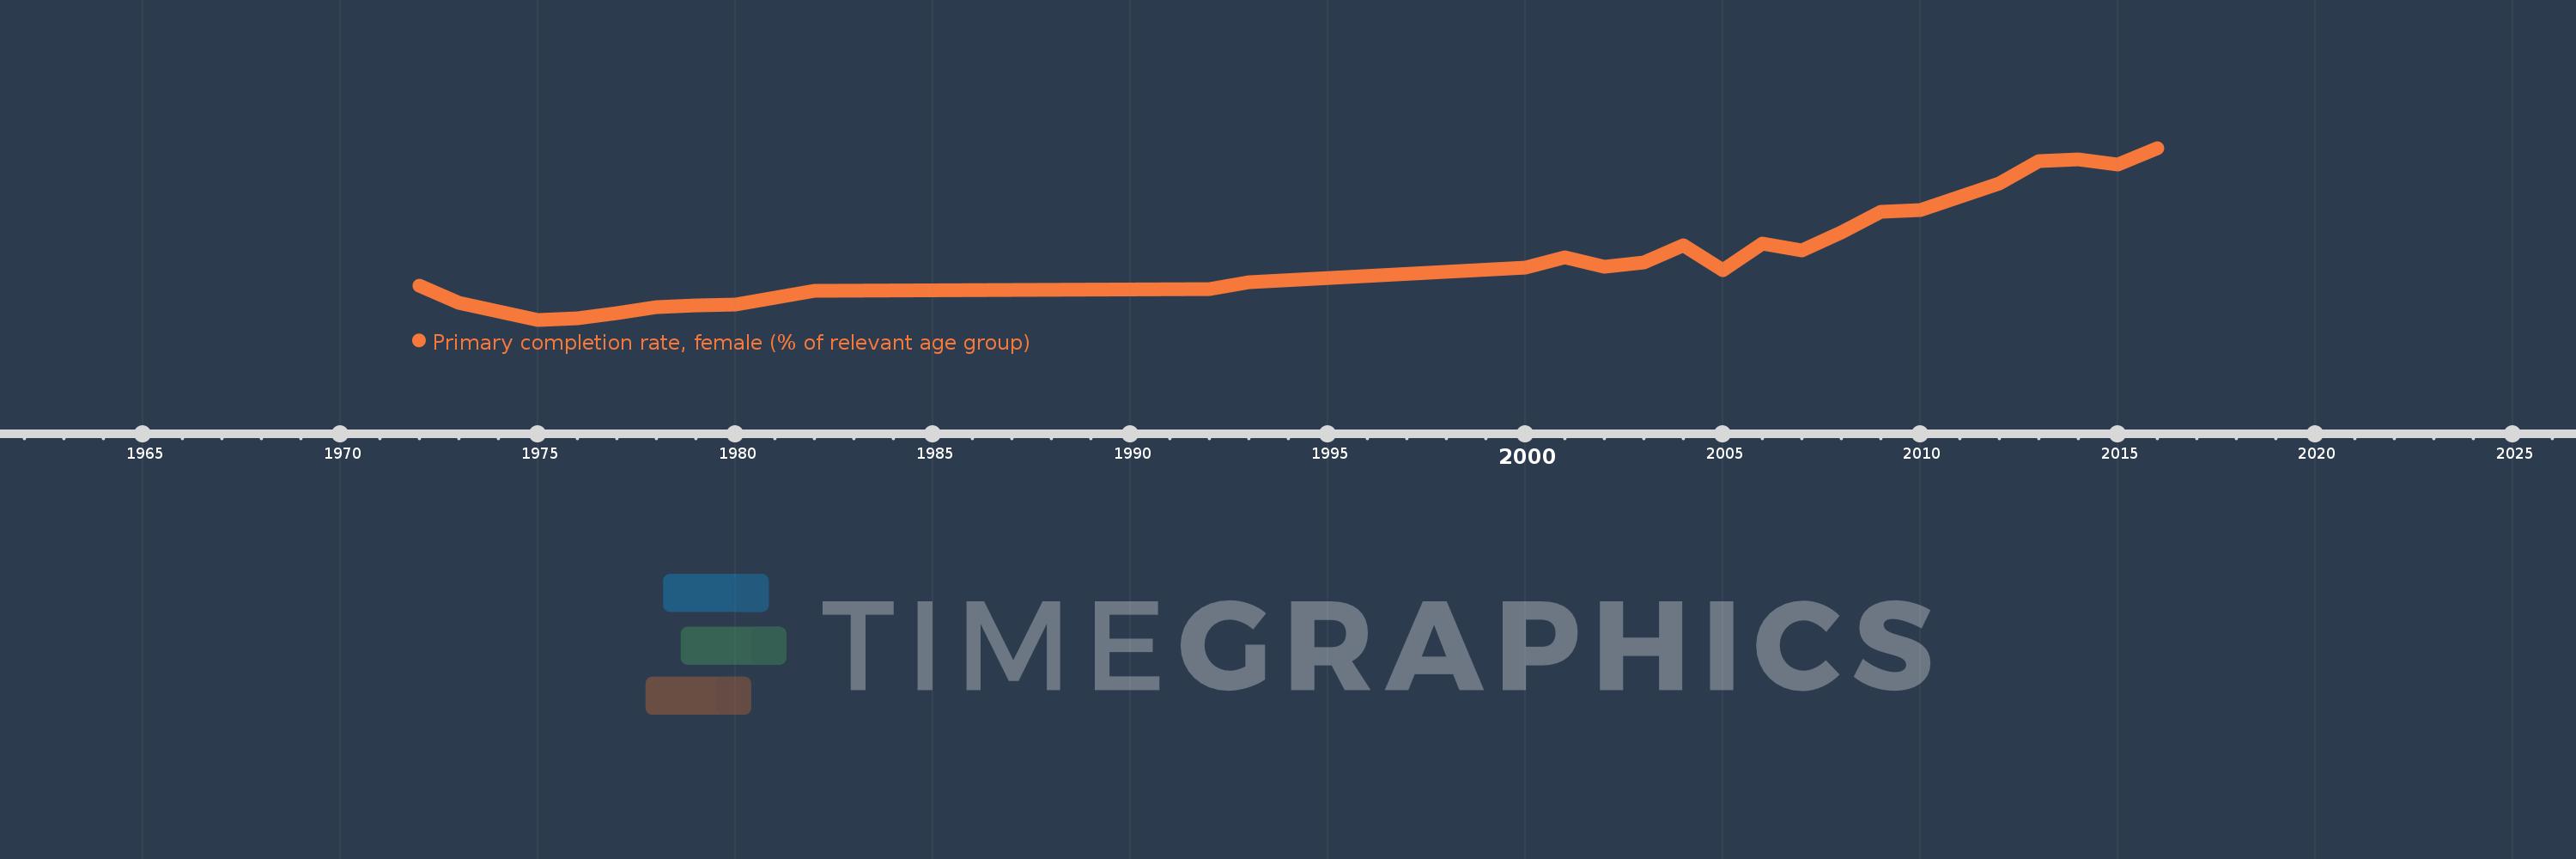
Primary completion rate, female (% of relevant age group)
2016,2015,2014,2013,2012,2010,2009,2008,2007,2006,2005,2004,2003,2002,2001,2000,1993,1992,1982,1981,1980,1979,1978,1977,1976,1975,1973,1972
