29
/
en
AIzaSyAYiBZKx7MnpbEhh9jyipgxe19OcubqV5w
April 1, 2024
39472
IDA only
IDX
false
2
1
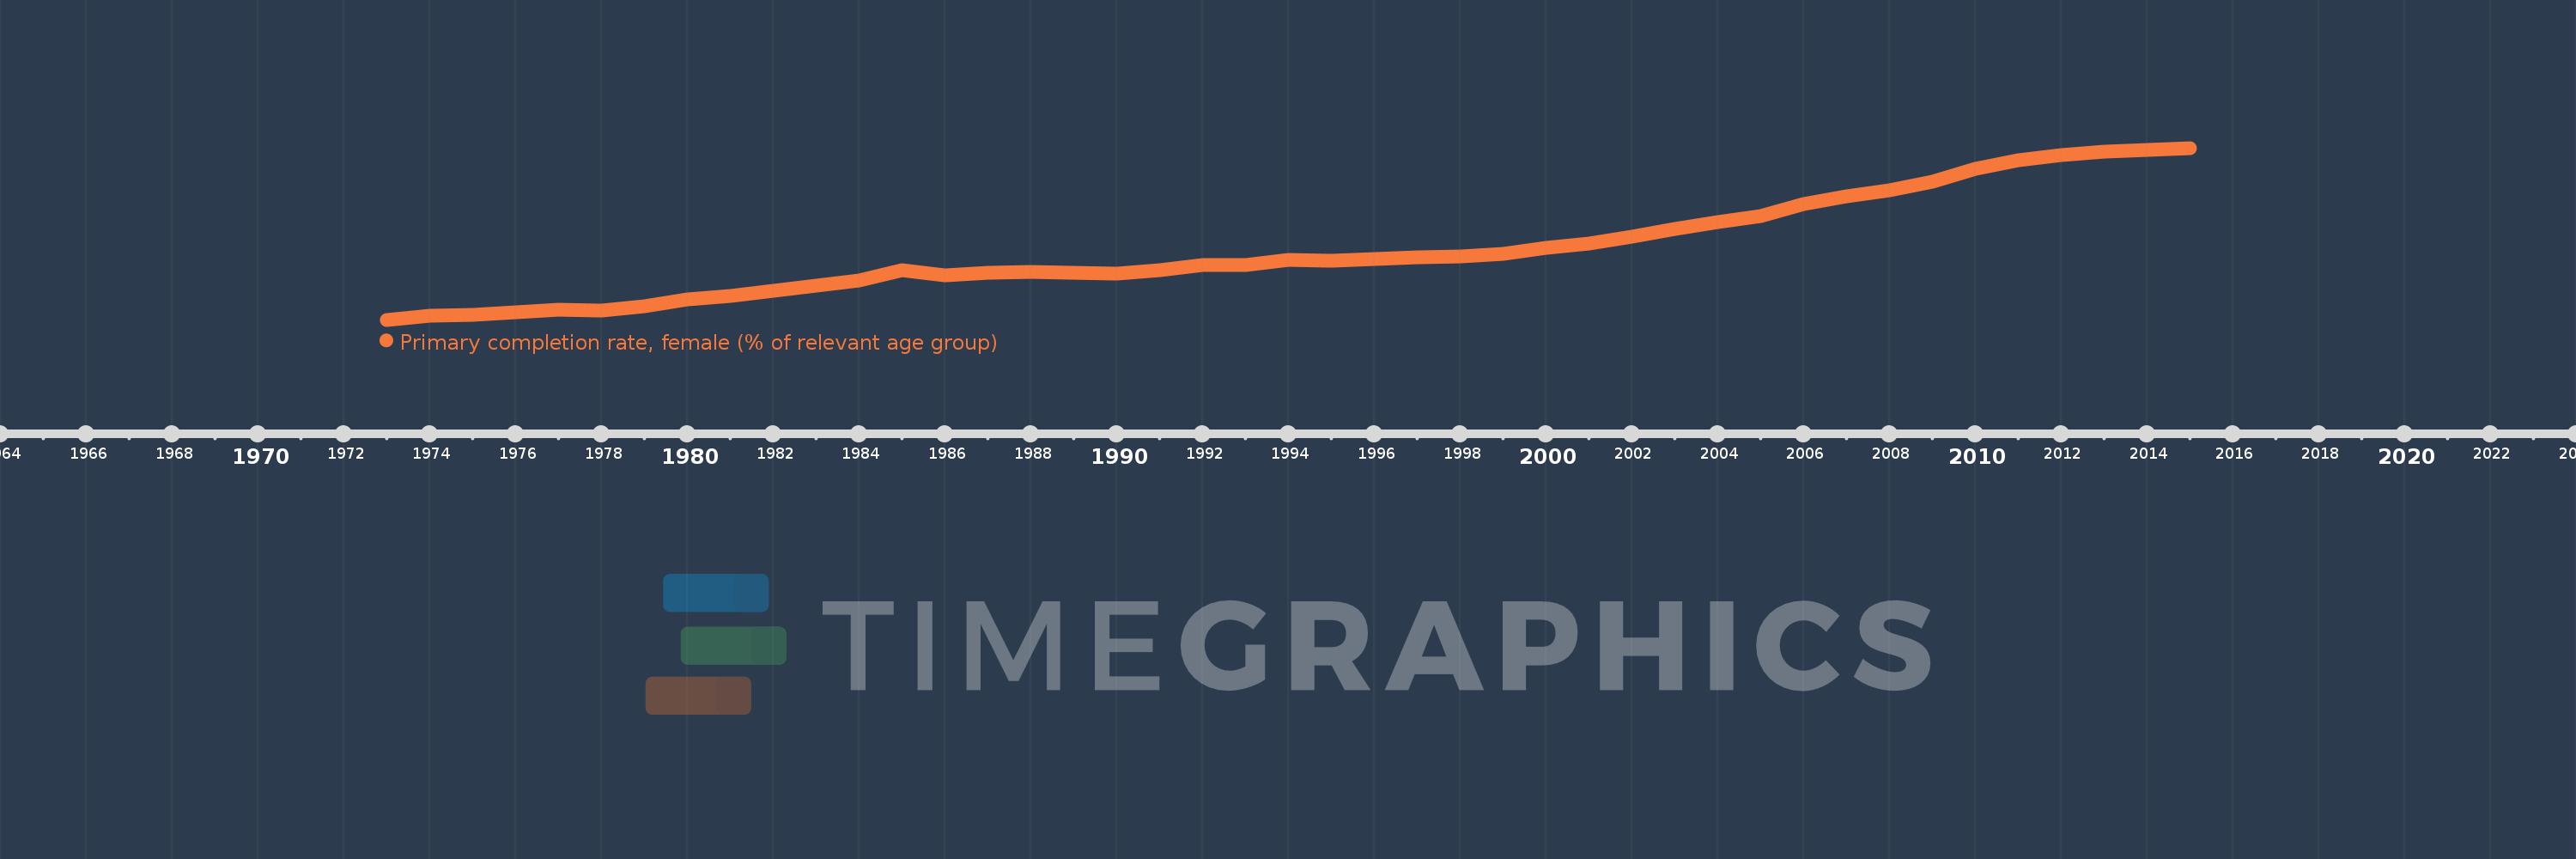
Primary completion rate, female (% of relevant age group)
2015,2014,2013,2012,2011,2010,2009,2008,2007,2006,2005,2004,2003,2002,2001,2000,1999,1998,1997,1996,1995,1994,1993,1992,1991,1990,1989,1988,1987,1986,1985,1984,1983,1982,1981,1980,1979,1978,1977,1976,1975,1974,1973
This statistics in other country:
AfghanistanAlbaniaAlgeriaAngolaAntigua and BarbudaArab WorldArgentinaArmeniaArubaAustriaAzerbaijanBahamas, TheBahrainBangladeshBarbadosBelarusBelgiumBelizeBeninBermudaBhutanBoliviaBosnia and HerzegovinaBotswanaBrunei DarussalamBulgariaBurkina FasoBurundiCabo VerdeCambodiaCameroonCanadaCaribbean small statesCentral African RepublicCentral Europe and the BalticsChadChileChinaColombiaComorosCongo, Dem. Rep.Congo, Rep.Costa RicaCote d'IvoireCroatiaCubaCyprusCzech RepublicDenmarkDjiboutiDominicaDominican RepublicEarly-demographic dividendEast Asia & PacificEast Asia & Pacific (excluding high income)East Asia & Pacific (IDA & IBRD countries)EcuadorEgypt, Arab Rep.El SalvadorEquatorial GuineaEritreaEstoniaEthiopiaEuro areaEurope & Central AsiaEurope & Central Asia (excluding high income)Europe & Central Asia (IDA & IBRD countries)European UnionFijiFinlandFragile and conflict affected situationsFranceGabonGambia, TheGeorgiaGermanyGhanaGreeceGrenadaGuatemalaGuineaGuinea-BissauGuyanaHaitiHeavily indebted poor countries (HIPC)High incomeHondurasHong Kong SAR, ChinaHungaryIBRD onlyIcelandIDA & IBRD totalIDA blendIDA onlyIDA totalIndiaIndonesiaIran, Islamic Rep.IraqIrelandIsraelItalyJamaicaJapanJordanKazakhstanKenyaKiribatiKorea, Dem. People’s Rep.Korea, Rep.KuwaitKyrgyz RepublicLao PDRLate-demographic dividendLatin America & Caribbean Latin America & Caribbean (excluding high income)Latin America & the Caribbean (IDA & IBRD countries)LatviaLeast developed countries: UN classificationLebanonLesothoLiberiaLibyaLiechtensteinLithuaniaLow & middle incomeLow incomeLower middle incomeLuxembourgMacao SAR, ChinaMacedonia, FYRMadagascarMalawiMaldivesMaliMaltaMarshall IslandsMauritaniaMauritiusMexicoMiddle East & North AfricaMiddle East & North Africa (excluding high income)Middle East & North Africa (IDA & IBRD countries)Middle incomeMoldovaMongoliaMontenegroMoroccoMozambiqueMyanmarNamibiaNauruNepalNetherlandsNew ZealandNicaraguaNigerNigeriaNorwayOECD membersOmanOther small statesPacific island small statesPakistanPalauPanamaPapua New GuineaParaguayPeruPhilippinesPolandPortugalPost-demographic dividendPre-demographic dividendQatarRomaniaRussian FederationRwandaSamoaSan MarinoSao Tome and PrincipeSaudi ArabiaSenegalSerbiaSeychellesSierra LeoneSlovak RepublicSloveniaSmall statesSolomon IslandsSouth AfricaSouth AsiaSouth Asia (IDA & IBRD)South SudanSpainSri LankaSt. Kitts and NevisSt. LuciaSt. Vincent and the GrenadinesSub-Saharan Africa Sub-Saharan Africa (excluding high income)Sub-Saharan Africa (IDA & IBRD countries)SudanSurinameSwazilandSwedenSwitzerlandSyrian Arab RepublicTajikistanTanzaniaThailandTimor-LesteTogoTongaTrinidad and TobagoTunisiaTurkeyTuvaluUgandaUkraineUnited Arab EmiratesUpper middle incomeUruguayUzbekistanVanuatuVenezuela, RBVietnamWest Bank and GazaWorldYemen, Rep.ZambiaZimbabwe Timeline:
This timeline shows a graph from 1973 to 2015 of IDA only. No data until 1972. Number of actual observations by date: 43.
Source name:
World Development Indicators
Source organization:
United Nations Educational, Scientific, and Cultural Organization (UNESCO) Institute for Statistics.
Categories, topics:
Education, Gender
Last updated:
apr 23, 2017
Indicators value changes by year
Maximum:
69.075
jan 1, 2015
At the date of observation
Value
Absolute change
Change from previous value
jan 1, 1973
27.9
+27.9
0.0%
jan 1, 1974
28.807
+0.907
3.25%
jan 1, 1975
29.131
+0.324
1.12%
jan 1, 1976
29.775
+0.644
2.21%
jan 1, 1977
30.397
+0.623
2.09%
jan 1, 1978
30.104
-0.294
-0.97%
jan 1, 1979
31.151
+1.047
3.48%
jan 1, 1980
32.78
+1.629
5.23%
jan 1, 1981
33.664
+0.884
2.7%
jan 1, 1982
34.911
+1.248
3.71%
jan 1, 1983
36.097
+1.186
3.4%
jan 1, 1984
37.359
+1.262
3.49%
jan 1, 1985
39.769
+2.41
6.45%
jan 1, 1986
38.532
-1.238
-3.11%
jan 1, 1987
39.077
+0.546
1.42%
jan 1, 1988
39.284
+0.207
0.53%
jan 1, 1989
39.22
-0.064
-0.16%
jan 1, 1990
38.929
-0.291
-0.74%
jan 1, 1991
39.878
+0.949
2.44%
jan 1, 1992
40.982
+1.104
2.77%
jan 1, 1993
41.098
+0.115
0.28%
jan 1, 1994
42.248
+1.151
2.8%
jan 1, 1995
42.059
-0.189
-0.45%
jan 1, 1996
42.404
+0.345
0.82%
jan 1, 1997
42.965
+0.561
1.32%
jan 1, 1998
43.172
+0.207
0.48%
jan 1, 1999
43.693
+0.522
1.21%
jan 1, 2000
45.184
+1.491
3.41%
jan 1, 2001
46.115
+0.931
2.06%
jan 1, 2002
47.849
+1.734
3.76%
jan 1, 2003
49.642
+1.793
3.75%
jan 1, 2004
51.4
+1.758
3.54%
jan 1, 2005
52.76
+1.36
2.65%
jan 1, 2006
55.564
+2.804
5.31%
jan 1, 2007
57.571
+2.007
3.61%
jan 1, 2008
58.861
+1.291
2.24%
jan 1, 2009
61.047
+2.186
3.71%
jan 1, 2010
64.083
+3.035
4.97%
jan 1, 2011
66.049
+1.966
3.07%
jan 1, 2012
67.38
+1.331
2.02%
jan 1, 2013
68.254
+0.874
1.3%
jan 1, 2014
68.54
+0.286
0.42%
jan 1, 2015
69.075
+0.535
0.78%
Ranking of countries by current statistics by years


Comments: