29
/
en
AIzaSyAYiBZKx7MnpbEhh9jyipgxe19OcubqV5w
April 1, 2024
161889
Italy
ITA
true
2
1
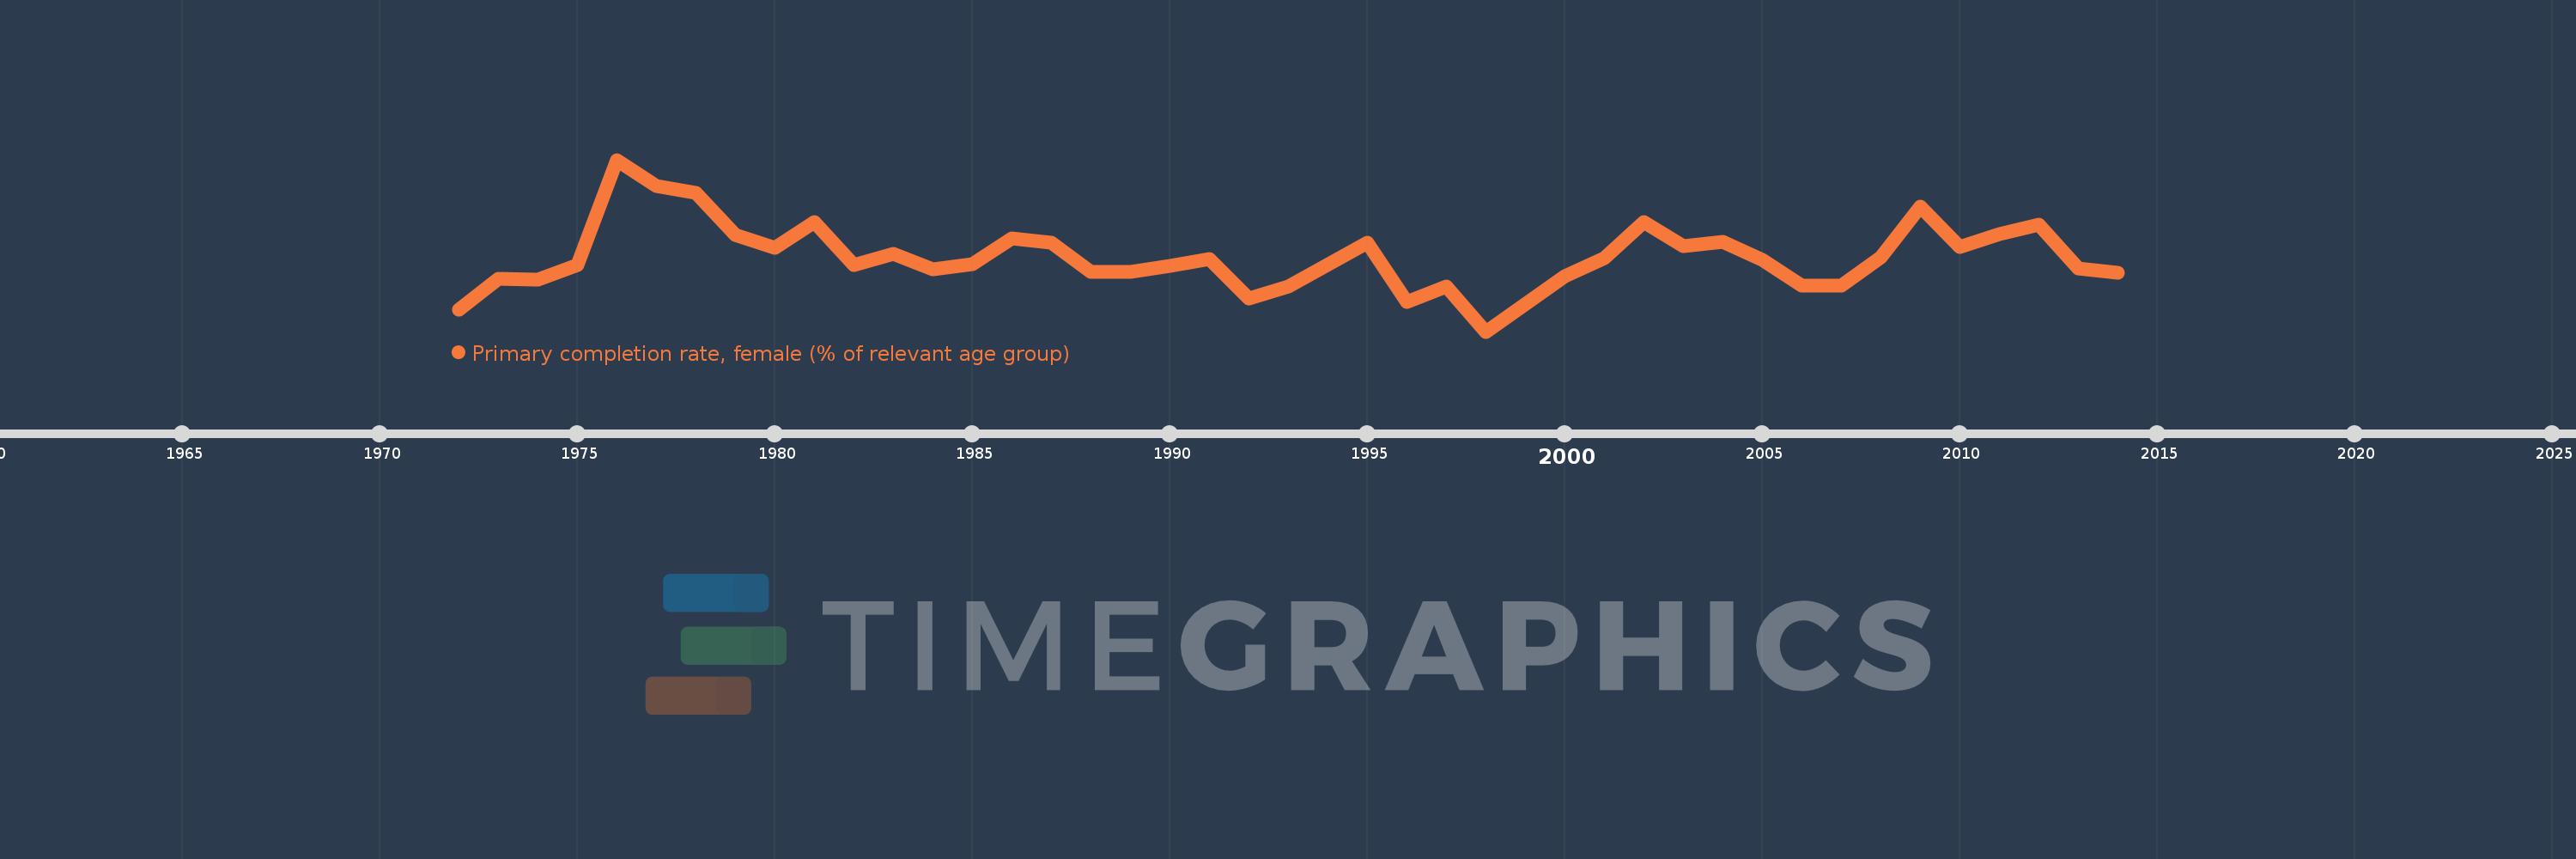
Primary completion rate, female (% of relevant age group)
2014,2013,2012,2011,2010,2009,2008,2007,2006,2005,2004,2003,2002,2001,2000,1998,1997,1996,1995,1993,1992,1991,1990,1989,1988,1987,1986,1985,1984,1983,1982,1981,1980,1979,1978,1977,1976,1975,1974,1973,1972
This statistics in other country:
AfghanistanAlbaniaAlgeriaAngolaAntigua and BarbudaArab WorldArgentinaArmeniaArubaAustriaAzerbaijanBahamas, TheBahrainBangladeshBarbadosBelarusBelgiumBelizeBeninBermudaBhutanBoliviaBosnia and HerzegovinaBotswanaBrunei DarussalamBulgariaBurkina FasoBurundiCabo VerdeCambodiaCameroonCanadaCaribbean small statesCentral African RepublicCentral Europe and the BalticsChadChileChinaColombiaComorosCongo, Dem. Rep.Congo, Rep.Costa RicaCote d'IvoireCroatiaCubaCyprusCzech RepublicDenmarkDjiboutiDominicaDominican RepublicEarly-demographic dividendEast Asia & PacificEast Asia & Pacific (excluding high income)East Asia & Pacific (IDA & IBRD countries)EcuadorEgypt, Arab Rep.El SalvadorEquatorial GuineaEritreaEstoniaEthiopiaEuro areaEurope & Central AsiaEurope & Central Asia (excluding high income)Europe & Central Asia (IDA & IBRD countries)European UnionFijiFinlandFragile and conflict affected situationsFranceGabonGambia, TheGeorgiaGermanyGhanaGreeceGrenadaGuatemalaGuineaGuinea-BissauGuyanaHaitiHeavily indebted poor countries (HIPC)High incomeHondurasHong Kong SAR, ChinaHungaryIBRD onlyIcelandIDA & IBRD totalIDA blendIDA onlyIDA totalIndiaIndonesiaIran, Islamic Rep.IraqIrelandIsraelItalyJamaicaJapanJordanKazakhstanKenyaKiribatiKorea, Dem. People’s Rep.Korea, Rep.KuwaitKyrgyz RepublicLao PDRLate-demographic dividendLatin America & Caribbean Latin America & Caribbean (excluding high income)Latin America & the Caribbean (IDA & IBRD countries)LatviaLeast developed countries: UN classificationLebanonLesothoLiberiaLibyaLiechtensteinLithuaniaLow & middle incomeLow incomeLower middle incomeLuxembourgMacao SAR, ChinaMacedonia, FYRMadagascarMalawiMaldivesMaliMaltaMarshall IslandsMauritaniaMauritiusMexicoMiddle East & North AfricaMiddle East & North Africa (excluding high income)Middle East & North Africa (IDA & IBRD countries)Middle incomeMoldovaMongoliaMontenegroMoroccoMozambiqueMyanmarNamibiaNauruNepalNetherlandsNew ZealandNicaraguaNigerNigeriaNorwayOECD membersOmanOther small statesPacific island small statesPakistanPalauPanamaPapua New GuineaParaguayPeruPhilippinesPolandPortugalPost-demographic dividendPre-demographic dividendQatarRomaniaRussian FederationRwandaSamoaSan MarinoSao Tome and PrincipeSaudi ArabiaSenegalSerbiaSeychellesSierra LeoneSlovak RepublicSloveniaSmall statesSolomon IslandsSouth AfricaSouth AsiaSouth Asia (IDA & IBRD)South SudanSpainSri LankaSt. Kitts and NevisSt. LuciaSt. Vincent and the GrenadinesSub-Saharan Africa Sub-Saharan Africa (excluding high income)Sub-Saharan Africa (IDA & IBRD countries)SudanSurinameSwazilandSwedenSwitzerlandSyrian Arab RepublicTajikistanTanzaniaThailandTimor-LesteTogoTongaTrinidad and TobagoTunisiaTurkeyTuvaluUgandaUkraineUnited Arab EmiratesUpper middle incomeUruguayUzbekistanVanuatuVenezuela, RBVietnamWest Bank and GazaWorldYemen, Rep.ZambiaZimbabwe Timeline:
This timeline shows a graph from 1972 to 2014 of Italy. No data until 1971. Number of actual observations by date: 41.
Source name:
World Development Indicators
Source organization:
United Nations Educational, Scientific, and Cultural Organization (UNESCO) Institute for Statistics.
Categories, topics:
Education, Gender
Last updated:
apr 23, 2017
Indicators value changes by year
Minimum:
95.593
jan 1, 1998
Maximum:
108.047
jan 1, 1976
At the date of observation
Value
Absolute change
Change from previous value
jan 1, 1972
97.151
+97.151
0.0%
jan 1, 1973
99.433
+2.281
2.35%
jan 1, 1974
99.366
-0.067
-0.07%
jan 1, 1975
100.407
+1.041
1.05%
jan 1, 1976
108.047
+7.64
7.61%
jan 1, 1977
106.155
-1.893
-1.75%
jan 1, 1978
105.665
-0.489
-0.46%
jan 1, 1979
102.588
-3.078
-2.91%
jan 1, 1980
101.687
-0.9
-0.88%
jan 1, 1981
103.522
+1.835
1.8%
jan 1, 1982
100.439
-3.083
-2.98%
jan 1, 1983
101.255
+0.816
0.81%
jan 1, 1984
100.125
-1.129
-1.12%
jan 1, 1985
100.463
+0.338
0.34%
jan 1, 1986
102.361
+1.898
1.89%
jan 1, 1987
102.055
-0.306
-0.3%
jan 1, 1988
99.947
-2.108
-2.07%
jan 1, 1989
99.892
-0.055
-0.06%
jan 1, 1990
100.372
+0.48
0.48%
jan 1, 1991
100.874
+0.502
0.5%
jan 1, 1992
97.967
-2.907
-2.88%
jan 1, 1993
98.869
+0.902
0.92%
jan 1, 1995
102.011
+3.143
3.18%
jan 1, 1996
97.743
-4.269
-4.18%
jan 1, 1997
98.865
+1.123
1.15%
jan 1, 1998
95.593
-3.272
-3.31%
jan 1, 2000
99.637
+4.044
4.23%
jan 1, 2001
100.914
+1.276
1.28%
jan 1, 2002
103.531
+2.617
2.59%
jan 1, 2003
101.791
-1.74
-1.68%
jan 1, 2004
102.117
+0.326
0.32%
jan 1, 2005
100.794
-1.324
-1.3%
jan 1, 2006
98.923
-1.871
-1.86%
jan 1, 2007
98.952
+0.029
0.03%
jan 1, 2008
100.962
+2.01
2.03%
jan 1, 2009
104.628
+3.666
3.63%
jan 1, 2010
101.752
-2.876
-2.75%
jan 1, 2011
102.676
+0.924
0.91%
jan 1, 2012
103.354
+0.678
0.66%
jan 1, 2013
100.166
-3.188
-3.08%
jan 1, 2014
99.866
-0.3
-0.3%
Ranking of countries by current statistics by years


Comments: