29
/
en
AIzaSyAYiBZKx7MnpbEhh9jyipgxe19OcubqV5w
April 1, 2024
94825
Burkina Faso
BFA
true
2
1
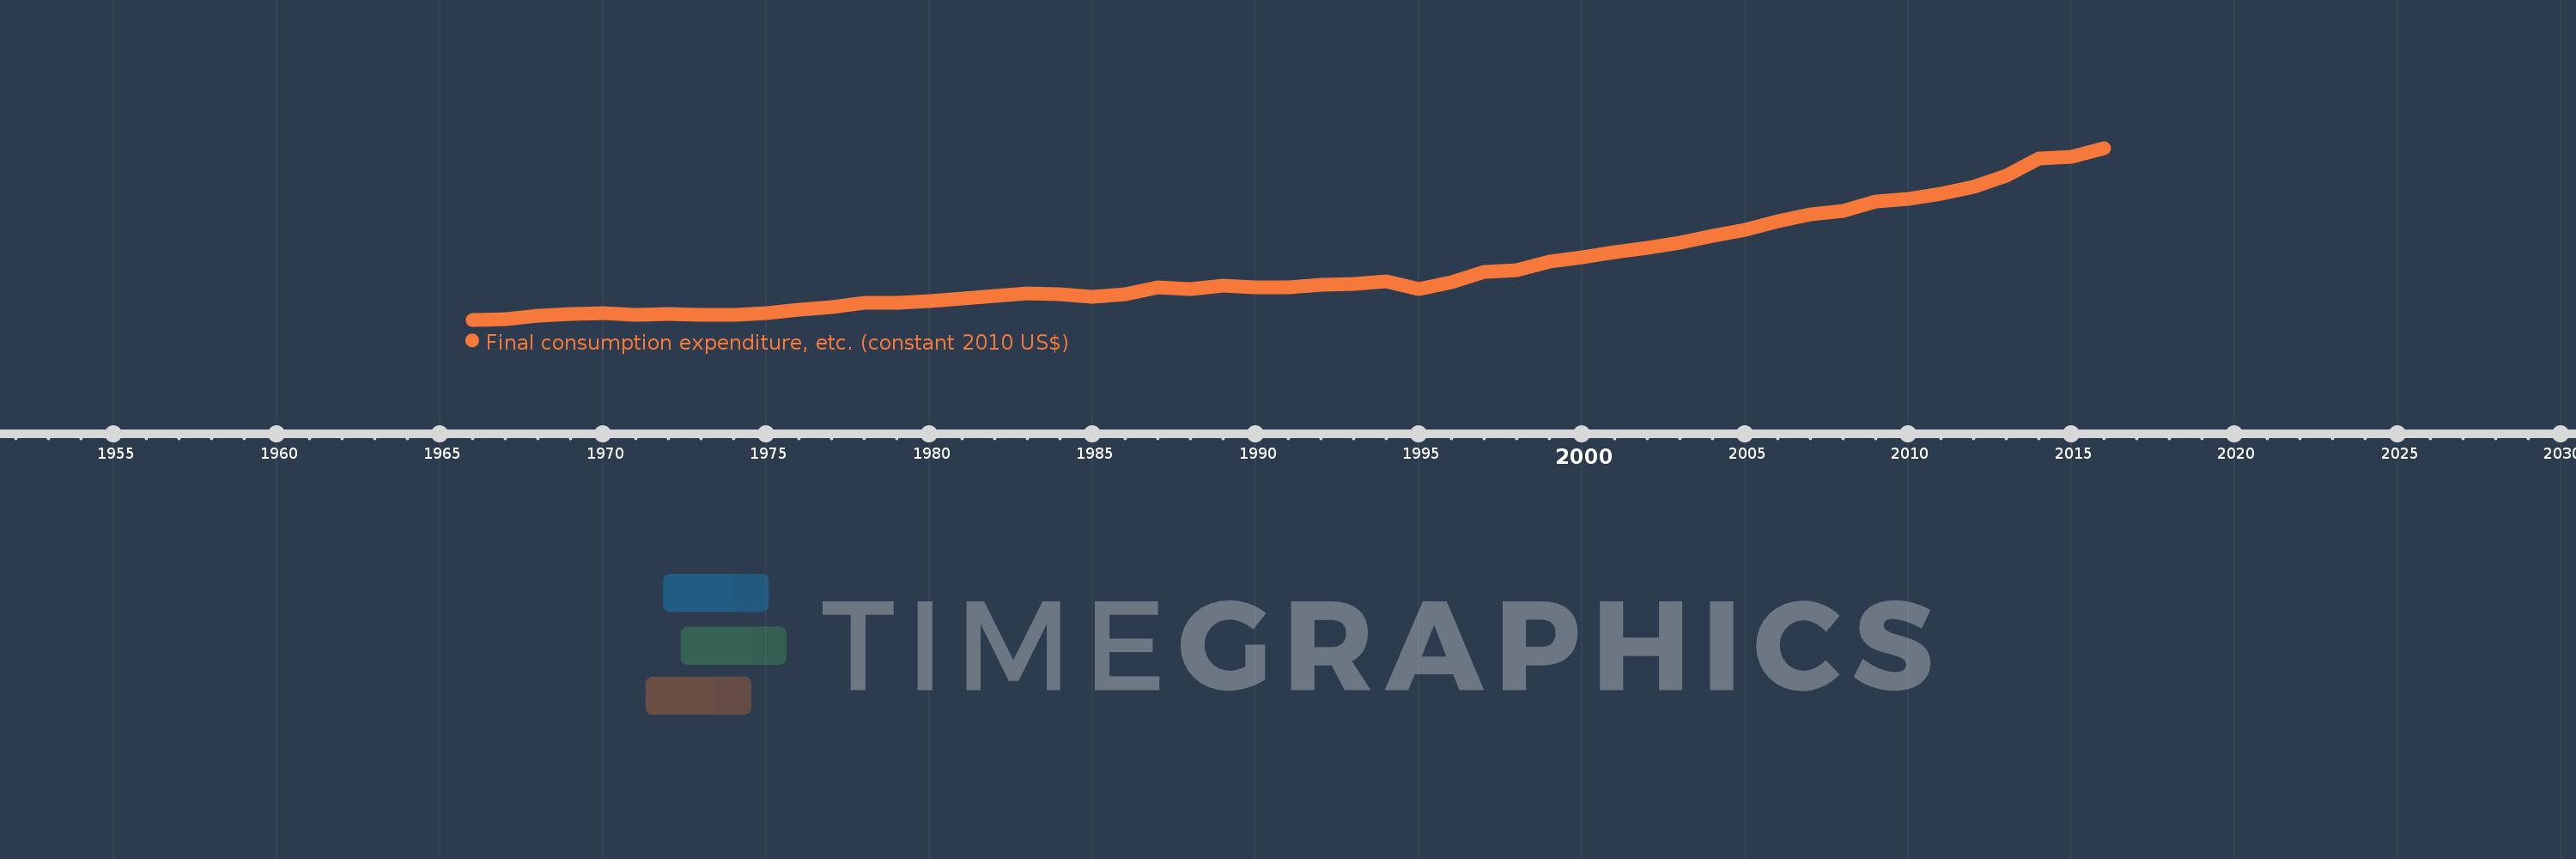
Final consumption expenditure, etc. (constant 2010 US$)
2016,2015,2014,2013,2012,2011,2010,2009,2008,2007,2006,2005,2004,2003,2002,2001,2000,1999,1998,1997,1996,1995,1994,1993,1992,1991,1990,1989,1988,1987,1986,1985,1984,1983,1982,1981,1980,1979,1978,1977,1976,1975,1974,1973,1972,1971,1970,1969,1968,1967,1966
This statistics in other country:
AfghanistanAlbaniaAlgeriaAngolaAntigua and BarbudaArab WorldArgentinaArmeniaArubaAustraliaAustriaAzerbaijanBahamas, TheBahrainBangladeshBarbadosBelarusBelgiumBelizeBeninBermudaBhutanBoliviaBosnia and HerzegovinaBotswanaBrazilBrunei DarussalamBulgariaBurkina FasoBurundiCabo VerdeCambodiaCameroonCanadaCaribbean small statesCentral African RepublicCentral Europe and the BalticsChadChileChinaColombiaComorosCongo, Dem. Rep.Congo, Rep.Cote d'IvoireCroatiaCubaCyprusCzech RepublicDenmarkDominicaDominican RepublicEarly-demographic dividendEast Asia & PacificEast Asia & Pacific (excluding high income)East Asia & Pacific (IDA & IBRD countries)EcuadorEgypt, Arab Rep.El SalvadorEquatorial GuineaEritreaEstoniaEuro areaEurope & Central AsiaEurope & Central Asia (excluding high income)Europe & Central Asia (IDA & IBRD countries)European UnionFaroe IslandsFinlandFragile and conflict affected situationsFranceGabonGambia, TheGeorgiaGermanyGhanaGreeceGrenadaGuatemalaGuineaGuinea-BissauGuyanaHaitiHeavily indebted poor countries (HIPC)High incomeHondurasHong Kong SAR, ChinaHungaryIBRD onlyIcelandIDA & IBRD totalIDA blendIDA onlyIDA totalIndiaIndonesiaIran, Islamic Rep.IraqIrelandIsraelItalyJamaicaJapanJordanKazakhstanKenyaKorea, Rep.KosovoKuwaitKyrgyz RepublicLao PDRLate-demographic dividendLatin America & Caribbean Latin America & Caribbean (excluding high income)Latin America & the Caribbean (IDA & IBRD countries)LatviaLeast developed countries: UN classificationLebanonLiberiaLithuaniaLow & middle incomeLow incomeLower middle incomeLuxembourgMacao SAR, ChinaMacedonia, FYRMadagascarMalawiMalaysiaMaliMaltaMauritaniaMauritiusMexicoMiddle East & North AfricaMiddle East & North Africa (excluding high income)Middle East & North Africa (IDA & IBRD countries)Middle incomeMoldovaMongoliaMontenegroMoroccoMozambiqueNamibiaNepalNetherlandsNew ZealandNicaraguaNigerNigeriaNorth AmericaNorwayOECD membersOmanOther small statesPakistanPanamaParaguayPeruPhilippinesPolandPortugalPost-demographic dividendPre-demographic dividendPuerto RicoQatarRomaniaRussian FederationRwandaSaudi ArabiaSenegalSerbiaSeychellesSierra LeoneSingaporeSlovak RepublicSloveniaSmall statesSouth AfricaSouth AsiaSouth Asia (IDA & IBRD)South SudanSpainSri LankaSt. Kitts and NevisSt. LuciaSt. Vincent and the GrenadinesSub-Saharan Africa Sub-Saharan Africa (excluding high income)Sub-Saharan Africa (IDA & IBRD countries)SudanSurinameSwazilandSwedenSwitzerlandTajikistanTanzaniaThailandTimor-LesteTogoTongaTrinidad and TobagoTunisiaTurkeyTurkmenistanUgandaUkraineUnited Arab EmiratesUnited KingdomUnited StatesUpper middle incomeUruguayUzbekistanVanuatuVenezuela, RBVietnamWest Bank and GazaWorldYemen, Rep.ZambiaZimbabwe Timeline:
This timeline shows a graph from 1966 to 2016 of Burkina Faso. No data until 1965. Number of actual observations by date: 51.
Source name:
World Development Indicators
Source organization:
World Bank national accounts data, and OECD National Accounts data files.
Categories, topics:
Economy & Growth
Last updated:
apr 23, 2017
Indicators value changes by year
Minimum:
1.442 bln
jan 1, 1966
Maximum:
9.732 bln
jan 1, 2016
At the date of observation
Value
Absolute change
Change from previous value
jan 1, 1966
1.442 bln
+1.442 bln
0.0%
jan 1, 1967
1.453 bln
+11.246 mln
0.78%
jan 1, 1968
1.653 bln
+199.526 mln
13.73%
jan 1, 1969
1.725 bln
+72.437 mln
4.38%
jan 1, 1970
1.763 bln
+37.671 mln
2.18%
jan 1, 1971
1.676 bln
-86.598 mln
-4.91%
jan 1, 1972
1.719 bln
+42.796 mln
2.55%
jan 1, 1973
1.678 bln
-41.471 mln
-2.41%
jan 1, 1974
1.671 bln
-7.065 mln
-0.42%
jan 1, 1975
1.765 bln
+94.813 mln
5.68%
jan 1, 1976
1.946 bln
+180.119 mln
10.2%
jan 1, 1977
2.036 bln
+89.952 mln
4.62%
jan 1, 1978
2.258 bln
+222.163 mln
10.91%
jan 1, 1979
2.253 bln
-4.576 mln
-0.2%
jan 1, 1980
2.336 bln
+83.068 mln
3.69%
jan 1, 1981
2.471 bln
+134.348 mln
5.75%
jan 1, 1982
2.595 bln
+124.095 mln
5.02%
jan 1, 1983
2.723 bln
+128.452 mln
4.95%
jan 1, 1984
2.69 bln
-33.241 mln
-1.22%
jan 1, 1985
2.547 bln
-142.835 mln
-5.31%
jan 1, 1986
2.655 bln
+108.464 mln
4.26%
jan 1, 1987
2.995 bln
+339.505 mln
12.79%
jan 1, 1988
2.921 bln
-73.979 mln
-2.47%
jan 1, 1989
3.074 bln
+153.275 mln
5.25%
jan 1, 1990
3.024 bln
-49.93 mln
-1.62%
jan 1, 1991
2.984 bln
-39.909 mln
-1.32%
jan 1, 1992
3.147 bln
+162.775 mln
5.45%
jan 1, 1993
3.151 bln
+3.484 mln
0.11%
jan 1, 1994
3.293 bln
+142.452 mln
4.52%
jan 1, 1995
2.903 bln
-390.545 mln
-11.86%
jan 1, 1996
3.266 bln
+363.213 mln
12.51%
jan 1, 1997
3.741 bln
+474.74 mln
14.54%
jan 1, 1998
3.819 bln
+78.127 mln
2.09%
jan 1, 1999
4.261 bln
+442.369 mln
11.58%
jan 1, 2000
4.471 bln
+209.466 mln
4.92%
jan 1, 2001
4.695 bln
+224.011 mln
5.01%
jan 1, 2002
4.922 bln
+227.623 mln
4.85%
jan 1, 2003
5.154 bln
+231.609 mln
4.71%
jan 1, 2004
5.507 bln
+353.235 mln
6.85%
jan 1, 2005
5.792 bln
+285.446 mln
5.18%
jan 1, 2006
6.214 bln
+421.583 mln
7.28%
jan 1, 2007
6.528 bln
+313.803 mln
5.05%
jan 1, 2008
6.691 bln
+162.958 mln
2.5%
jan 1, 2009
7.166 bln
+475.664 mln
7.11%
jan 1, 2010
7.287 bln
+121.054 mln
1.69%
jan 1, 2011
7.504 bln
+216.432 mln
2.97%
jan 1, 2012
7.851 bln
+347.025 mln
4.62%
jan 1, 2013
8.402 bln
+550.647 mln
7.01%
jan 1, 2014
9.242 bln
+840.761 mln
10.01%
jan 1, 2015
9.315 bln
+72.795 mln
0.79%
jan 1, 2016
9.732 bln
+416.992 mln
4.48%
Ranking of countries by current statistics by years


Comments: