29
/
en
AIzaSyAYiBZKx7MnpbEhh9jyipgxe19OcubqV5w
April 1, 2024
37325
IDA & IBRD total
IBT
false
2
1
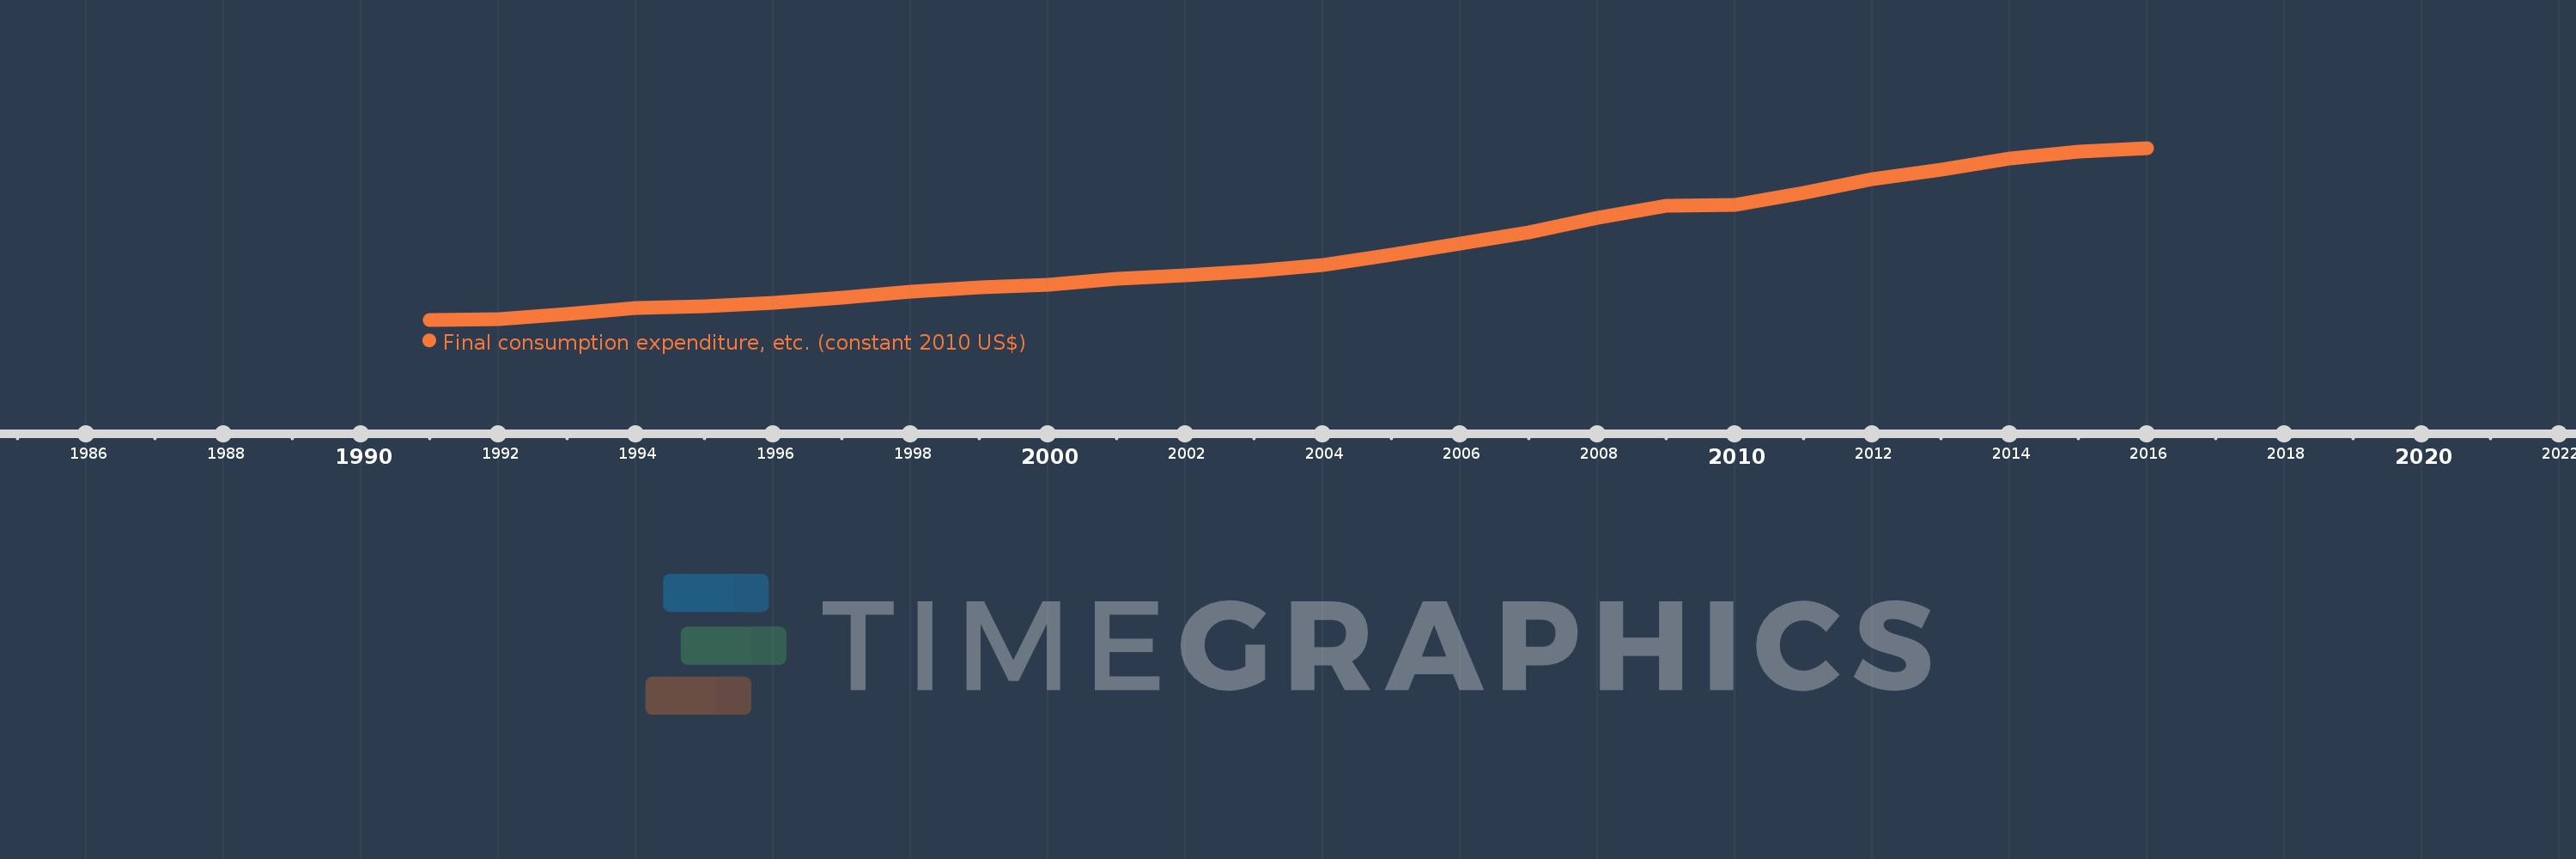
Final consumption expenditure, etc. (constant 2010 US$)
2016,2015,2014,2013,2012,2011,2010,2009,2008,2007,2006,2005,2004,2003,2002,2001,2000,1999,1998,1997,1996,1995,1994,1993,1992,1991
This statistics in other country:
AfghanistanAlbaniaAlgeriaAngolaAntigua and BarbudaArab WorldArgentinaArmeniaArubaAustraliaAustriaAzerbaijanBahamas, TheBahrainBangladeshBarbadosBelarusBelgiumBelizeBeninBermudaBhutanBoliviaBosnia and HerzegovinaBotswanaBrazilBrunei DarussalamBulgariaBurkina FasoBurundiCabo VerdeCambodiaCameroonCanadaCaribbean small statesCentral African RepublicCentral Europe and the BalticsChadChileChinaColombiaComorosCongo, Dem. Rep.Congo, Rep.Cote d'IvoireCroatiaCubaCyprusCzech RepublicDenmarkDominicaDominican RepublicEarly-demographic dividendEast Asia & PacificEast Asia & Pacific (excluding high income)East Asia & Pacific (IDA & IBRD countries)EcuadorEgypt, Arab Rep.El SalvadorEquatorial GuineaEritreaEstoniaEuro areaEurope & Central AsiaEurope & Central Asia (excluding high income)Europe & Central Asia (IDA & IBRD countries)European UnionFaroe IslandsFinlandFragile and conflict affected situationsFranceGabonGambia, TheGeorgiaGermanyGhanaGreeceGrenadaGuatemalaGuineaGuinea-BissauGuyanaHaitiHeavily indebted poor countries (HIPC)High incomeHondurasHong Kong SAR, ChinaHungaryIBRD onlyIcelandIDA & IBRD totalIDA blendIDA onlyIDA totalIndiaIndonesiaIran, Islamic Rep.IraqIrelandIsraelItalyJamaicaJapanJordanKazakhstanKenyaKorea, Rep.KosovoKuwaitKyrgyz RepublicLao PDRLate-demographic dividendLatin America & Caribbean Latin America & Caribbean (excluding high income)Latin America & the Caribbean (IDA & IBRD countries)LatviaLeast developed countries: UN classificationLebanonLiberiaLithuaniaLow & middle incomeLow incomeLower middle incomeLuxembourgMacao SAR, ChinaMacedonia, FYRMadagascarMalawiMalaysiaMaliMaltaMauritaniaMauritiusMexicoMiddle East & North AfricaMiddle East & North Africa (excluding high income)Middle East & North Africa (IDA & IBRD countries)Middle incomeMoldovaMongoliaMontenegroMoroccoMozambiqueNamibiaNepalNetherlandsNew ZealandNicaraguaNigerNigeriaNorth AmericaNorwayOECD membersOmanOther small statesPakistanPanamaParaguayPeruPhilippinesPolandPortugalPost-demographic dividendPre-demographic dividendPuerto RicoQatarRomaniaRussian FederationRwandaSaudi ArabiaSenegalSerbiaSeychellesSierra LeoneSingaporeSlovak RepublicSloveniaSmall statesSouth AfricaSouth AsiaSouth Asia (IDA & IBRD)South SudanSpainSri LankaSt. Kitts and NevisSt. LuciaSt. Vincent and the GrenadinesSub-Saharan Africa Sub-Saharan Africa (excluding high income)Sub-Saharan Africa (IDA & IBRD countries)SudanSurinameSwazilandSwedenSwitzerlandTajikistanTanzaniaThailandTimor-LesteTogoTongaTrinidad and TobagoTunisiaTurkeyTurkmenistanUgandaUkraineUnited Arab EmiratesUnited KingdomUnited StatesUpper middle incomeUruguayUzbekistanVanuatuVenezuela, RBVietnamWest Bank and GazaWorldYemen, Rep.ZambiaZimbabwe Timeline:
This timeline shows a graph from 1991 to 2016 of IDA & IBRD total. No data until 1990. Number of actual observations by date: 26.
Source name:
World Development Indicators
Source organization:
World Bank national accounts data, and OECD National Accounts data files.
Categories, topics:
Economy & Growth
Last updated:
apr 23, 2017
Indicators value changes by year
Minimum:
6.864 trl
jan 1, 1991
Maximum:
16.915 trl
jan 1, 2016
At the date of observation
Value
Absolute change
Change from previous value
jan 1, 1991
6.864 trl
+6.864 trl
0.0%
jan 1, 1992
6.914 trl
+50.159 bln
0.73%
jan 1, 1993
7.222 trl
+307.862 bln
4.45%
jan 1, 1994
7.547 trl
+325.162 bln
4.5%
jan 1, 1995
7.659 trl
+112.647 bln
1.49%
jan 1, 1996
7.831 trl
+171.597 bln
2.24%
jan 1, 1997
8.178 trl
+347.39 bln
4.44%
jan 1, 1998
8.521 trl
+342.514 bln
4.19%
jan 1, 1999
8.758 trl
+236.7 bln
2.78%
jan 1, 2000
8.899 trl
+141.302 bln
1.61%
jan 1, 2001
9.25 trl
+350.711 bln
3.94%
jan 1, 2002
9.476 trl
+226.084 bln
2.44%
jan 1, 2003
9.695 trl
+219.286 bln
2.31%
jan 1, 2004
10.069 trl
+373.671 bln
3.85%
jan 1, 2005
10.68 trl
+611.19 bln
6.07%
jan 1, 2006
11.296 trl
+616.53 bln
5.77%
jan 1, 2007
11.96 trl
+663.451 bln
5.87%
jan 1, 2008
12.828 trl
+867.667 bln
7.25%
jan 1, 2009
13.517 trl
+689.469 bln
5.37%
jan 1, 2010
13.585 trl
+67.909 bln
0.5%
jan 1, 2011
14.291 trl
+705.81 bln
5.2%
jan 1, 2012
15.071 trl
+780.033 bln
5.46%
jan 1, 2013
15.667 trl
+596.282 bln
3.96%
jan 1, 2014
16.282 trl
+615.437 bln
3.93%
jan 1, 2015
16.681 trl
+398.867 bln
2.45%
jan 1, 2016
16.915 trl
+233.88 bln
1.4%
Ranking of countries by current statistics by years


Comments: