29
/
en
AIzaSyAYiBZKx7MnpbEhh9jyipgxe19OcubqV5w
April 1, 2024
272202
Uganda
UGA
true
2
1
Final consumption expenditure, etc. (constant 2010 US$)
2016,2015,2014,2013,2012,2011,2010,2009,2008,2007,2006,2005,2004,2003,2002,2001,2000,1999,1998,1997,1996,1995,1994,1993,1992,1991,1990,1989,1988,1987,1986,1985,1984,1983
This statistics in other country:
AfghanistanAlbaniaAlgeriaAngolaAntigua and BarbudaArab WorldArgentinaArmeniaArubaAustraliaAustriaAzerbaijanBahamas, TheBahrainBangladeshBarbadosBelarusBelgiumBelizeBeninBermudaBhutanBoliviaBosnia and HerzegovinaBotswanaBrazilBrunei DarussalamBulgariaBurkina FasoBurundiCabo VerdeCambodiaCameroonCanadaCaribbean small statesCentral African RepublicCentral Europe and the BalticsChadChileChinaColombiaComorosCongo, Dem. Rep.Congo, Rep.Cote d'IvoireCroatiaCubaCyprusCzech RepublicDenmarkDominicaDominican RepublicEarly-demographic dividendEast Asia & PacificEast Asia & Pacific (excluding high income)East Asia & Pacific (IDA & IBRD countries)EcuadorEgypt, Arab Rep.El SalvadorEquatorial GuineaEritreaEstoniaEuro areaEurope & Central AsiaEurope & Central Asia (excluding high income)Europe & Central Asia (IDA & IBRD countries)European UnionFaroe IslandsFinlandFragile and conflict affected situationsFranceGabonGambia, TheGeorgiaGermanyGhanaGreeceGrenadaGuatemalaGuineaGuinea-BissauGuyanaHaitiHeavily indebted poor countries (HIPC)High incomeHondurasHong Kong SAR, ChinaHungaryIBRD onlyIcelandIDA & IBRD totalIDA blendIDA onlyIDA totalIndiaIndonesiaIran, Islamic Rep.IraqIrelandIsraelItalyJamaicaJapanJordanKazakhstanKenyaKorea, Rep.KosovoKuwaitKyrgyz RepublicLao PDRLate-demographic dividendLatin America & Caribbean Latin America & Caribbean (excluding high income)Latin America & the Caribbean (IDA & IBRD countries)LatviaLeast developed countries: UN classificationLebanonLiberiaLithuaniaLow & middle incomeLow incomeLower middle incomeLuxembourgMacao SAR, ChinaMacedonia, FYRMadagascarMalawiMalaysiaMaliMaltaMauritaniaMauritiusMexicoMiddle East & North AfricaMiddle East & North Africa (excluding high income)Middle East & North Africa (IDA & IBRD countries)Middle incomeMoldovaMongoliaMontenegroMoroccoMozambiqueNamibiaNepalNetherlandsNew ZealandNicaraguaNigerNigeriaNorth AmericaNorwayOECD membersOmanOther small statesPakistanPanamaParaguayPeruPhilippinesPolandPortugalPost-demographic dividendPre-demographic dividendPuerto RicoQatarRomaniaRussian FederationRwandaSaudi ArabiaSenegalSerbiaSeychellesSierra LeoneSingaporeSlovak RepublicSloveniaSmall statesSouth AfricaSouth AsiaSouth Asia (IDA & IBRD)South SudanSpainSri LankaSt. Kitts and NevisSt. LuciaSt. Vincent and the GrenadinesSub-Saharan Africa Sub-Saharan Africa (excluding high income)Sub-Saharan Africa (IDA & IBRD countries)SudanSurinameSwazilandSwedenSwitzerlandTajikistanTanzaniaThailandTimor-LesteTogoTongaTrinidad and TobagoTunisiaTurkeyTurkmenistanUgandaUkraineUnited Arab EmiratesUnited KingdomUnited StatesUpper middle incomeUruguayUzbekistanVanuatuVenezuela, RBVietnamWest Bank and GazaWorldYemen, Rep.ZambiaZimbabwe Timeline:
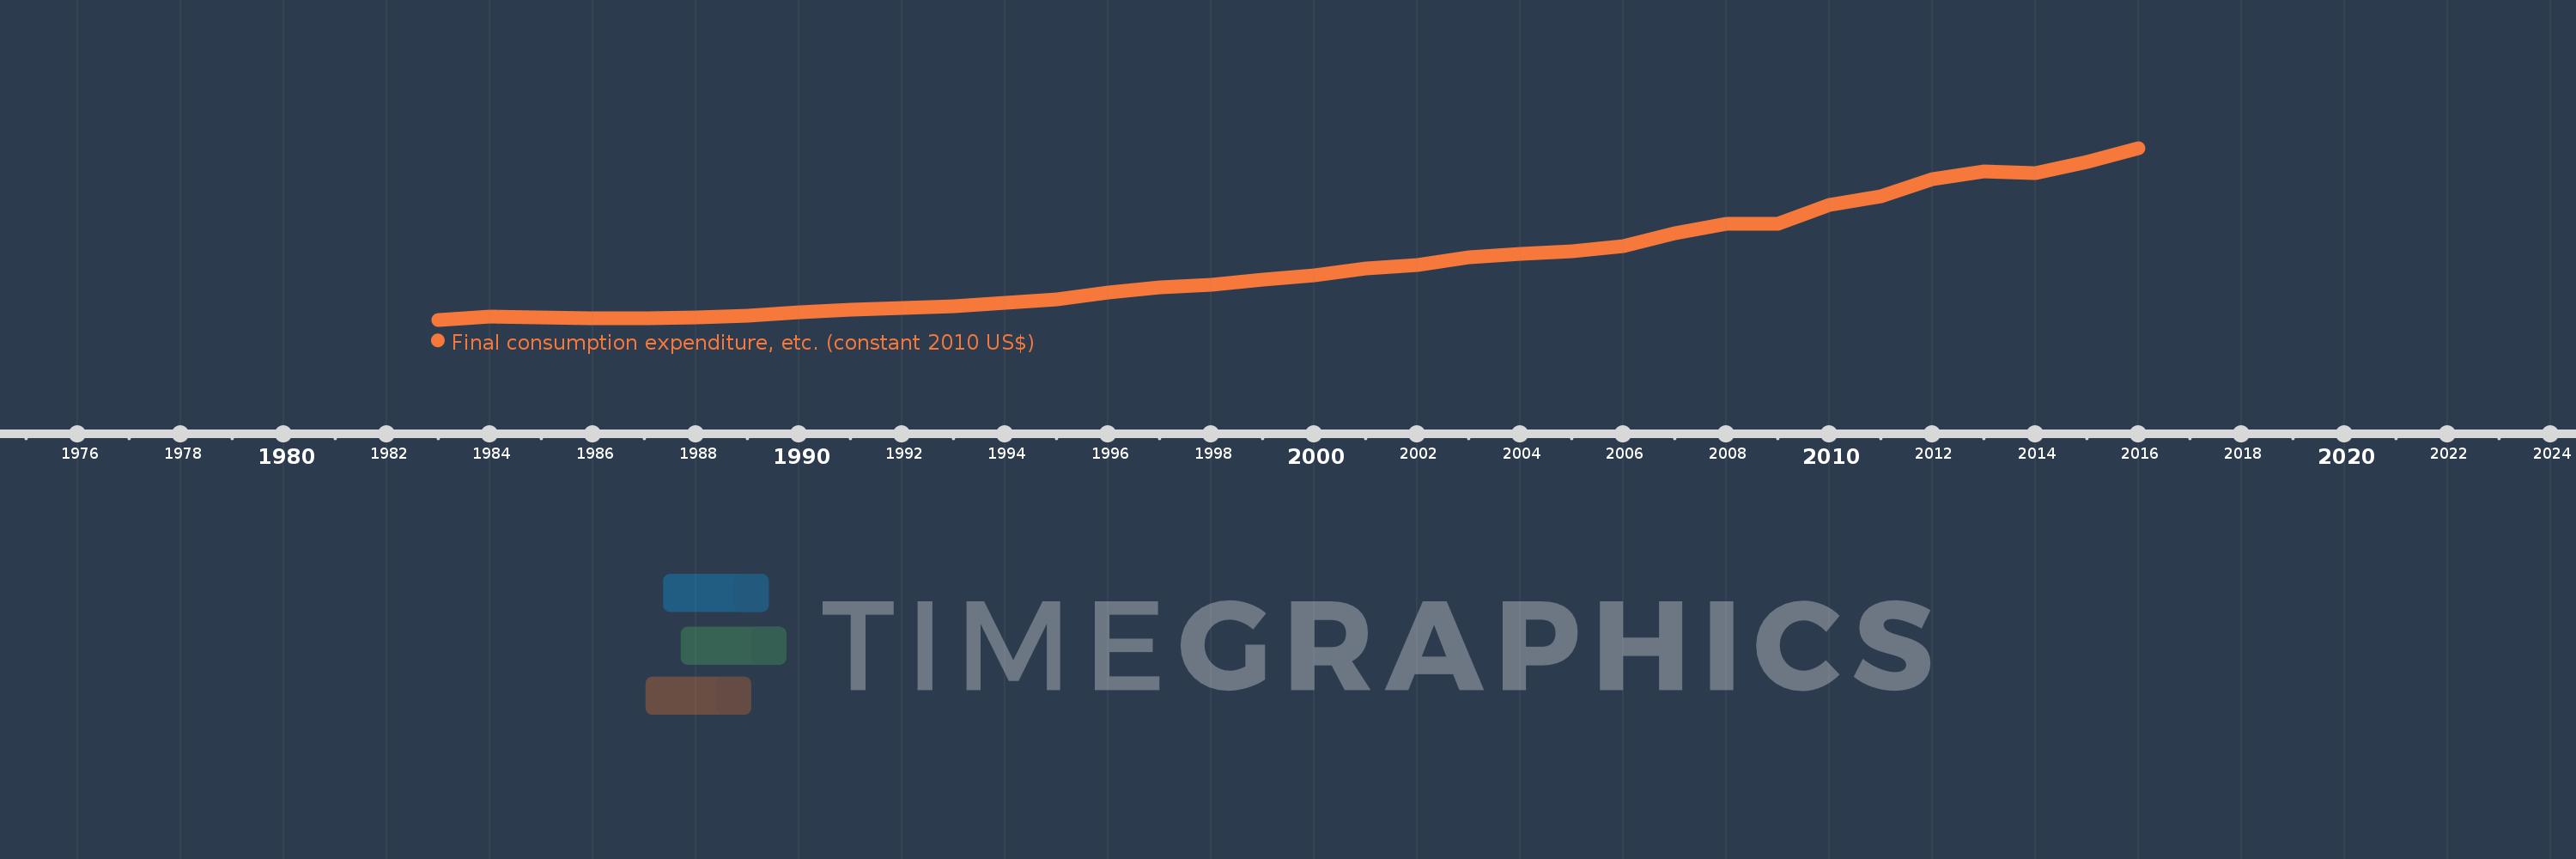
This timeline shows a graph from 1983 to 2016 of Uganda. No data until 1982. Number of actual observations by date: 34.
Source name:
World Development Indicators
Source organization:
World Bank national accounts data, and OECD National Accounts data files.
Categories, topics:
Economy & Growth
Last updated:
apr 23, 2017
Indicators value changes by year
Minimum:
3.911 bln
jan 1, 1983
Maximum:
22.261 bln
jan 1, 2016
At the date of observation
Value
Absolute change
Change from previous value
jan 1, 1983
3.911 bln
+3.911 bln
0.0%
jan 1, 1984
4.225 bln
+313.323 mln
8.01%
jan 1, 1985
4.143 bln
-81.702 mln
-1.93%
jan 1, 1986
4.029 bln
-114.409 mln
-2.76%
jan 1, 1987
4.051 bln
+22.931 mln
0.57%
jan 1, 1988
4.134 bln
+82.085 mln
2.03%
jan 1, 1989
4.383 bln
+249.522 mln
6.04%
jan 1, 1990
4.688 bln
+305.308 mln
6.97%
jan 1, 1991
4.961 bln
+272.918 mln
5.82%
jan 1, 1992
5.19 bln
+228.566 mln
4.61%
jan 1, 1993
5.362 bln
+172.609 mln
3.33%
jan 1, 1994
5.764 bln
+401.602 mln
7.49%
jan 1, 1995
6.051 bln
+287.084 mln
4.98%
jan 1, 1996
6.787 bln
+735.4 mln
12.15%
jan 1, 1997
7.399 bln
+612.147 mln
9.02%
jan 1, 1998
7.67 bln
+271.29 mln
3.67%
jan 1, 1999
8.23 bln
+559.887 mln
7.3%
jan 1, 2000
8.643 bln
+413.251 mln
5.02%
jan 1, 2001
9.369 bln
+726.072 mln
8.4%
jan 1, 2002
9.722 bln
+352.688 mln
3.76%
jan 1, 2003
10.547 bln
+825.067 mln
8.49%
jan 1, 2004
10.953 bln
+406.517 mln
3.85%
jan 1, 2005
11.233 bln
+279.534 mln
2.55%
jan 1, 2006
11.809 bln
+575.568 mln
5.12%
jan 1, 2007
13.11 bln
+1.301 bln
11.02%
jan 1, 2008
14.147 bln
+1.037 bln
7.91%
jan 1, 2009
14.163 bln
+15.819 mln
0.11%
jan 1, 2010
16.137 bln
+1.974 bln
13.94%
jan 1, 2011
17.088 bln
+950.491 mln
5.89%
jan 1, 2012
18.959 bln
+1.872 bln
10.95%
jan 1, 2013
19.76 bln
+800.628 mln
4.22%
jan 1, 2014
19.565 bln
-195.403 mln
-0.99%
jan 1, 2015
20.779 bln
+1.214 bln
6.2%
jan 1, 2016
22.261 bln
+1.482 bln
7.13%
Ranking of countries by current statistics by years


Comments: